NetSpend 2012 Annual Report Download - page 55
Download and view the complete annual report
Please find page 55 of the 2012 NetSpend annual report below. You can navigate through the pages in the report by either clicking on the pages listed below, or by using the keyword search tool below to find specific information within the annual report.-
 1
1 -
2
-
3
-
4
-
5
-
6
-
7
-
8
-
9
-
10
-
11
-
12
-
13
-
14
-
15
-
16
-
17
-
18
-
19
-
20
-
21
-
22
-
23
-
24
-
25
-
26
-
27
-
28
-
29
-
30
-
31
-
32
-
33
-
34
-
35
-
36
-
37
-
38
-
39
-
40
-
41
-
42
-
43
-
44
-
 45
45 -
 46
46 -
 47
47 -
 48
48 -
 49
49 -
 50
50 -
 51
51 -
 52
52 -
 53
53 -
 54
54 -
 55
55 -
 56
56 -
 57
57 -
 58
58 -
 59
59 -
 60
60 -
 61
61 -
 62
62 -
 63
63 -
 64
64 -
 65
65 -
66
-
67
-
68
-
69
-
70
-
71
-
72
-
73
-
74
-
75
-
76
 |
 |

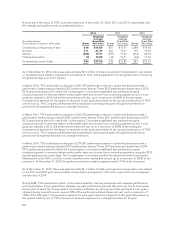
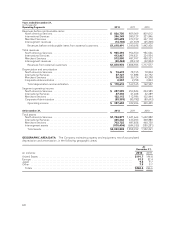
A summary of TSYS’ stock option activity as of December 31, 2012, 2011 and 2010, and changes during the years
ended on those dates is presented below:
2012 2011 2010
(in thousands,
except per share data) Options
Weighted
Average
Exercise Price Options
Weighted
Average
Exercise Price Options
Weighted
Average
Exercise Price
Options:
Outstanding at beginning of year . . 6,082 $20.61 8,810 $23.40 6,955 $25.54
Granted ........................ 818 22.95 717 17.61 2,177 15.89
Exercised ...................... (619) 16.15 (597) 13.51 (41) 13.11
Forfeited/canceled .............. (216) 23.73 (2,848) 29.96 (281) 19.83
Outstanding at end of year ........ 6,065 $21.27 6,082 $20.61 8,810 $23.40
Options exercisable at year-end .... 3,235 $24.12 3,122 $25.00 5,712 $27.48
Weighted average fair value of
options granted during the
year ......................... $ 5.27 $ 5.78 $ 4.11
As of December 31, 2012, the average remaining contractual life and intrinsic value of TSYS’ outstanding and
exercisable stock options were as follows:
Outstanding Exercisable
Average remaining contractual life (in years) ................................... 4.8 4.2
Aggregate intrinsic value (in thousands) ....................................... $909 $(8,735)
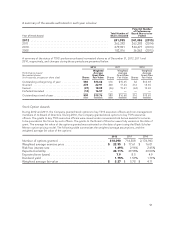
Shares Issued for Options Exercised
During 2012, 2011 and 2010, employees of the Company exercised options for shares of TSYS common stock
that were issued from treasury. The table below summarizes these stock option exercises by year:
Options Exercised
and Issued from
Treasury Intrinsic Value
2012 ............................................................. 618,752 $4,243,000
2011 ............................................................. 597,161 3,627,000
2010 ............................................................. 41,403 90,400
For awards granted before January 1, 2006 that were not fully vested on January 1, 2006, the Company will
record the tax benefits from the exercise of stock options as increases to the “Additional paid-in capital” line item
of the Consolidated Balance Sheets. If the Company does recognize tax benefits, the Company will record these
tax benefits from share-based compensation costs as cash inflows in the financing section and cash outflows in
the operating section in the Statement of Cash Flows. The Company has elected to use the short-cut method to
calculate its historical pool of windfall tax benefits.
As of December 31, 2012, there was approximately $3.9 million of total unrecognized compensation cost related
to TSYS stock options that is expected to be recognized over a remaining weighted average period of 1.3 years.
52