NetSpend 2012 Annual Report Download - page 15
Download and view the complete annual report
Please find page 15 of the 2012 NetSpend annual report below. You can navigate through the pages in the report by either clicking on the pages listed below, or by using the keyword search tool below to find specific information within the annual report.-
 1
1 -
2
-
3
-
4
-
 5
5 -
 6
6 -
 7
7 -
 8
8 -
 9
9 -
 10
10 -
 11
11 -
 12
12 -
 13
13 -
 14
14 -
 15
15 -
 16
16 -
 17
17 -
 18
18 -
 19
19 -
 20
20 -
 21
21 -
 22
22 -
 23
23 -
 24
24 -
 25
25 -
26
-
27
-
28
-
29
-
30
-
31
-
32
-
33
-
34
-
35
-
36
-
37
-
38
-
39
-
40
-
41
-
42
-
43
-
44
-
45
-
46
-
47
-
48
-
49
-
50
-
51
-
52
-
53
-
54
-
55
-
56
-
57
-
58
-
59
-
60
-
61
-
62
-
63
-
64
-
65
-
66
-
67
-
68
-
69
-
70
-
71
-
72
-
73
-
74
-
75
-
76
 |
 |

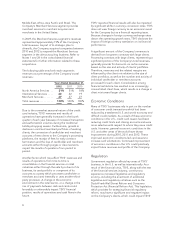
TSYS’ revenues in its North America Services and International Services segments are influenced by several
factors, including volumes related to AOF and transactions. TSYS estimates that approximately 49% of these
segments’ revenues is AOF and transaction volume driven. The remaining 51% of payment processing revenues
are not AOF and transaction volume driven, and are derived from production and optional services TSYS
considers to be value added products and services, custom programming and licensing arrangements.
Whether or not an account on file is active can impact TSYS’ revenues differently. Active accounts are accounts
that have had monetary activity either during the current month or in the past 90 days based on contractual
definition. Inactive accounts are accounts that have not had a monetary transaction (such as a purchase or
payment) in the past 90 days. The more active an account is, the more revenue is generated for TSYS (items such
as transactions and authorizations processed and statements billed).
Occasionally, a client will purge inactive accounts from its portfolio. An inactive account typically will only
generate an AOF charge. A processing client will periodically review its cardholder portfolio based upon activity
and usage. Each client, based upon criteria individually set by the client, will flag an account to be “purged” from
TSYS’ system and deactivated.
A deconversion involves a client migrating all of its accounts to an in-house solution or another processor.
Account deconversions include active and inactive accounts and can impact the Company’s revenues significantly
more than an account purge.
A sale of a portfolio typically involves a client selling a portion of its accounts to another party. A sale of a
portfolio and a deconversion impact the Company’s financial statements in a similar fashion, although a sale
usually has a smaller financial impact due to the number of accounts typically involved.
TSYS’ Merchant Services revenues are influenced by several factors, including volumes related to transactions and
dollar sales volume, which are approximately 76% of this segment’s revenues. The remaining 24% of Merchant
Services’ revenues are derived from value added services, monthly statement fees, compliance fees and
miscellaneous services.
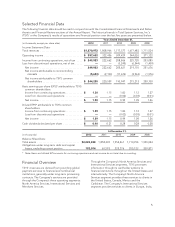
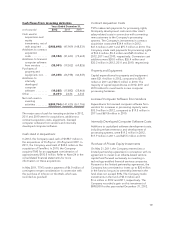
A summary of the consolidated financial highlights for the years ended December 31, 2012, 2011 and 2010 is
provided below:
Years Ended December 31, Percent Change
(in millions, except per share data) 2012 2011 2010 2012 vs. 2011 2011 vs. 2010
Total revenues ........................ $1,871.0 1,809.0 1,717.6 3.4% 5.3%
Operating income ..................... 357.7 322.5 309.4 10.9 4.2
Net income attributable to TSYS common
shareholders ........................ 244.3 220.6 193.9 10.8 13.7
Basic EPS(1) attributable to TSYS common
shareholders:
Income from continuing operations ..... 1.30 1.15 1.00 13.1 14.4
Net income ......................... 1.30 1.15 0.99 13.1 16.3
Diluted EPS(1) attributable to TSYS common
shareholders:
Income from continuing operations ..... 1.29 1.15 1.00 12.5 14.3
Net income ......................... 1.29 1.15 0.99 12.5 16.2
Cash flows from operating activities ...... 455.8 436.3 389.2 4.5 12.1
Key indicators:
AOF............................... 479.4 404.2 342.9 18.6 17.9
Cardholder transactions processed ..... 9,776.8 8,645.0 7,667.9 13.1 12.7
(1) Basic and diluted EPS is computed based on the two-class method in accordance with the guidance under
ASC 260 “Earnings Per Share.” Refer to Note 26 in the consolidated financial statements for more
information on EPS.
12