NetSpend 2012 Annual Report Download - page 21
Download and view the complete annual report
Please find page 21 of the 2012 NetSpend annual report below. You can navigate through the pages in the report by either clicking on the pages listed below, or by using the keyword search tool below to find specific information within the annual report.-
 1
1 -
2
-
3
-
4
-
5
-
6
-
7
-
8
-
9
-
10
-
 11
11 -
 12
12 -
 13
13 -
 14
14 -
 15
15 -
 16
16 -
 17
17 -
 18
18 -
 19
19 -
 20
20 -
 21
21 -
 22
22 -
 23
23 -
 24
24 -
 25
25 -
 26
26 -
 27
27 -
 28
28 -
 29
29 -
 30
30 -
 31
31 -
32
-
33
-
34
-
35
-
36
-
37
-
38
-
39
-
40
-
41
-
42
-
43
-
44
-
45
-
46
-
47
-
48
-
49
-
50
-
51
-
52
-
53
-
54
-
55
-
56
-
57
-
58
-
59
-
60
-
61
-
62
-
63
-
64
-
65
-
66
-
67
-
68
-
69
-
70
-
71
-
72
-
73
-
74
-
75
-
76
 |
 |

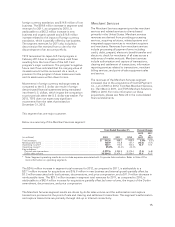
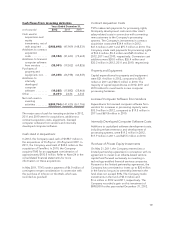
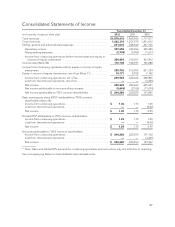
Below is the reconciliation between reported margins
and adjusted margins excluding reimbursable items
for the years ended December 31, 2012, 2011 and
2010:
Years Ended December 31,
(in thousands) 2012 2011 2010
Operating
income ....... $ 357,652 322,456 309,429
Net income ...... $ 249,923 222,662 205,621
Total revenues . . . $1,870,972 1,808,966 1,717,577
Less reimbursable
items ......... 252,481 268,268 275,141
Revenues before
reimbursable
items ......... $1,618,491 1,540,698 1,442,436
Operating margin
(as reported) . . . 19.1% 17.8% 18.0%
Net profit margin
(as reported) . . . 13.4% 12.3% 12.0%
Adjusted
operating
margin ........ 22.1% 20.9% 21.5%
Adjusted net profit
margin ........ 15.4% 14.5% 14.3%
Projected Outlook for 2013
As compared to 2012, TSYS expects its 2013 net
income attributable to TSYS common shareholders to
increase by 9%-11%, its EPS attributable to TSYS
common shareholders to increase by 10%-12%, its
revenues before reimbursable items to increase by
6%-8% and its total revenues to increase by 5%-7%,
based on the following assumptions with respect to
2013: (1) there will be no significant movements in
the London Interbank Offered Rate (LIBOR) and TSYS
will not make any significant draws on the remaining
balance of its revolving credit facility; (2) there will be
no significant movement in foreign currency
exchange rates related to TSYS’ business; (3) TSYS
will not incur significant expenses associated with the
conversion of new large clients other than included in
the 2013 estimate or acquisitions, or any significant
impairment of goodwill or other intangibles; (4) there
will be no deconversions of large clients during the
year; and (5) the economy will not worsen.
Financial Position, Liquidity
and Capital Resources
The Consolidated Statements of Cash Flows detail
the Company’s cash flows from operating, investing
and financing activities. TSYS’ primary methods for
funding its operations and growth have been cash
generated from current operations, the use of leases
and the occasional use of borrowed funds to
supplement financing of capital expenditures.
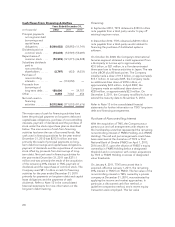
Cash Flows from Operating Activities
Years Ended December 31,
(in thousands) 2012 2011 2010
Net income ......... $249,923 222,662 205,621
Depreciation and
amortization ....... 170,610 169,165 163,111
Net change in current
and other assets and
current and other
liabilities .......... 14,627 18,682 4,520
Other noncash items
and charges, net . . . 13,069 18,975 7,745
Dividends from equity
investments ....... 7,524 6,835 6,572
Loss on disposal of
subsidiary ......... —— 1,591
Net cash provided by
operating
activities .......... $455,753 436,319 389,160
TSYS’ main source of funds is derived from operating
activities, specifically net income. The increase in
2012, as compared to 2011, in net cash provided by
operating activities was primarily the result of
increased earnings. The increase in 2011, as
compared to 2010, in net cash provided by operating
activities was primarily the result of increased
earnings and the net change in current and other
assets and current and other liabilities.
Net change in current and other assets and current
and other liabilities include accounts receivable,
prepaid expenses, other current assets and other
assets, accounts payable, accrued salaries and
employee benefits and other liabilities. The change in
accounts receivable between the years is the result of
timing of collections compared to billings. The
change in accounts payable and other liabilities
between years is the result of the timing of payments
and funding of performance-based incentives.
18