NetSpend 2012 Annual Report Download - page 63
Download and view the complete annual report
Please find page 63 of the 2012 NetSpend annual report below. You can navigate through the pages in the report by either clicking on the pages listed below, or by using the keyword search tool below to find specific information within the annual report.-
 1
1 -
2
-
3
-
4
-
5
-
6
-
7
-
8
-
9
-
10
-
11
-
12
-
13
-
14
-
15
-
16
-
17
-
18
-
19
-
20
-
21
-
22
-
23
-
24
-
25
-
26
-
27
-
28
-
29
-
30
-
31
-
32
-
33
-
34
-
35
-
36
-
37
-
38
-
39
-
40
-
41
-
42
-
43
-
44
-
45
-
46
-
47
-
48
-
49
-
50
-
51
-
52
-
 53
53 -
 54
54 -
 55
55 -
 56
56 -
 57
57 -
 58
58 -
 59
59 -
 60
60 -
 61
61 -
 62
62 -
 63
63 -
 64
64 -
 65
65 -
 66
66 -
 67
67 -
 68
68 -
 69
69 -
 70
70 -
 71
71 -
 72
72 -
 73
73 -
74
-
75
-
76
 |
 |

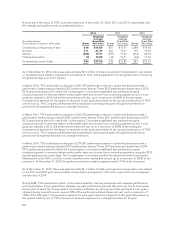
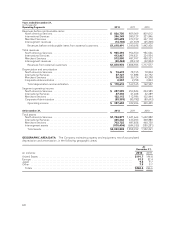
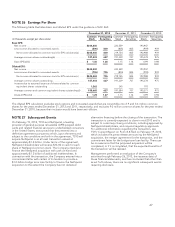
Years ended December 31,
(in thousands)
Operating Segments 2012 2011 2010
Revenues before reimbursable items
North America Services ......................................... $ 826,750 809,069 809,012
International Services .......................................... 396,149 380,129 321,846
Merchant Services ............................................. 409,698 373,159 337,178
Intersegment revenues ......................................... (14,106) (21,659) (25,600)
Revenues before reimbursable items from external customers ....... $1,618,491 1,540,698 1,442,436
Total revenues
North America Services ......................................... $ 965,393 954,550 956,546
International Services .......................................... 413,467 394,831 334,954
Merchant Services ............................................. 512,580 487,997 458,921
Intersegment revenues ......................................... (20,468) (28,412) (32,844)
Revenues from external customers ............................. $1,870,972 1,808,966 1,717,577
Depreciation and amortization
North America Services ......................................... $ 74,674 78,155 78,834
International Services .......................................... 57,127 51,888 40,792
Merchant Services ............................................. 36,252 36,124 40,298
Corporate Administration ....................................... 2,557 2,998 3,003
Total depreciation and amortization ............................ $ 170,610 169,165 162,927
Segment operating income
North America Services ......................................... $ 287,595 253,844 244,989
International Services .......................................... 27,335 41,408 42,689
Merchant Services ............................................. 132,115 112,986 102,444
Corporate Administration ....................................... (89,393) (85,782) (80,693)
Operating income ........................................... $ 357,652 322,456 309,429
At December 31, 2012 2011 2010
Total assets
North America Services ......................................... $1,744,877 1,621,664 1,632,882
International Services .......................................... 445,642 433,203 408,880
Merchant Services ............................................. 703,725 487,858 460,750
Intersegment assets ........................................... (870,406) (684,333) (550,251)
Total assets ................................................. $2,023,838 1,858,392 1,952,261
GEOGRAPHIC AREA DATA: The Company maintains property and equipment, net of accumulated
depreciation and amortization, in the following geographic areas:
At
December 31,
(in millions) 2012 2011
United States ..................................................................... $191.7 194.8
Europe .......................................................................... 51.3 52.4
Japan ........................................................................... 9.5 9.7
Other ........................................................................... 7.9 9.7
Totals ......................................................................... $260.4 266.6
60