NetSpend 2012 Annual Report Download - page 30
Download and view the complete annual report
Please find page 30 of the 2012 NetSpend annual report below. You can navigate through the pages in the report by either clicking on the pages listed below, or by using the keyword search tool below to find specific information within the annual report.-
 1
1 -
2
-
3
-
4
-
5
-
6
-
7
-
8
-
9
-
10
-
11
-
12
-
13
-
14
-
15
-
16
-
17
-
18
-
19
-
 20
20 -
 21
21 -
 22
22 -
 23
23 -
 24
24 -
 25
25 -
 26
26 -
 27
27 -
 28
28 -
 29
29 -
 30
30 -
 31
31 -
 32
32 -
 33
33 -
 34
34 -
 35
35 -
 36
36 -
 37
37 -
 38
38 -
 39
39 -
 40
40 -
41
-
42
-
43
-
44
-
45
-
46
-
47
-
48
-
49
-
50
-
51
-
52
-
53
-
54
-
55
-
56
-
57
-
58
-
59
-
60
-
61
-
62
-
63
-
64
-
65
-
66
-
67
-
68
-
69
-
70
-
71
-
72
-
73
-
74
-
75
-
76
 |
 |

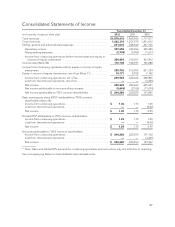
Consolidated Statements of Income
Years Ended December 31,
(in thousands, except per share data) 2012 2011 2010
Total revenues .................................................. $1,870,972 1,808,966 1,717,577
Cost of services ................................................. 1,262,310 1,257,970 1,201,012
Selling, general and administrative expenses ......................... 251,010 228,540 207,136
Operating income ............................................. 357,652 322,456 309,429
Nonoperating expenses ........................................ (2,798) (5,905) (1,617)
Income from continuing operations before income taxes and equity in
income of equity investments .................................. 354,854 316,551 307,812
Income taxes (Note 20) ........................................... 115,102 102,597 106,088
Income from continuing operations before equity in income of equity
investments .................................................. 239,752 213,954 201,724
Equity in income of equity investments, net of tax (Note 11) ............ 10,171 8,708 7,142
Income from continuing operations, net of tax ...................... 249,923 222,662 208,866
Loss from discontinued operations, net of tax ...................... —— (3,245)
Net income .................................................. 249,923 222,662 205,621
Net income attributable to noncontrolling interests ................. (5,643) (2,103) (11,674)
Net income attributable to TSYS common shareholders .............. $ 244,280 220,559 193,947
Basic earnings per share (EPS)* attributable to TSYS common
shareholders (Note 26):
Income from continuing operations ............................... $ 1.30 1.15 1.00
Loss from discontinued operations ............................... —— (0.02)
Net income .................................................. $ 1.30 1.15 0.99
Diluted EPS* attributable to TSYS common shareholders:
Income from continuing operations ............................... $ 1.29 1.15 1.00
Loss from discontinued operations ............................... —— (0.02)
Net income .................................................. $ 1.29 1.15 0.99
Amounts attributable to TSYS common shareholders:
Income from continuing operations ............................... $ 244,280 220,559 197,192
Loss from discontinued operations ............................... —— (3,245)
Net income .................................................. $ 244,280 220,559 193,947
* Note: Basic and diluted EPS amounts for continuing operations and net income may not total due to rounding.
See accompanying Notes to Consolidated Financial Statements
27