NetSpend 2012 Annual Report Download - page 17
Download and view the complete annual report
Please find page 17 of the 2012 NetSpend annual report below. You can navigate through the pages in the report by either clicking on the pages listed below, or by using the keyword search tool below to find specific information within the annual report.-
 1
1 -
2
-
3
-
4
-
5
-
6
-
 7
7 -
 8
8 -
 9
9 -
 10
10 -
 11
11 -
 12
12 -
 13
13 -
 14
14 -
 15
15 -
 16
16 -
 17
17 -
 18
18 -
 19
19 -
 20
20 -
 21
21 -
 22
22 -
 23
23 -
 24
24 -
 25
25 -
 26
26 -
 27
27 -
28
-
29
-
30
-
31
-
32
-
33
-
34
-
35
-
36
-
37
-
38
-
39
-
40
-
41
-
42
-
43
-
44
-
45
-
46
-
47
-
48
-
49
-
50
-
51
-
52
-
53
-
54
-
55
-
56
-
57
-
58
-
59
-
60
-
61
-
62
-
63
-
64
-
65
-
66
-
67
-
68
-
69
-
70
-
71
-
72
-
73
-
74
-
75
-
76
 |
 |

certain occurrences, the contracts provide the
segment with a steady revenue stream since a vast
majority of the contracts are honored through the
contracted expiration date.
These services are provided throughout the period of
each account’s use, starting from a card-issuing client
processing an application for a card. Services may
include processing the card application, initiating
service for the cardholder, processing each card
transaction for the issuing retailer or financial
institution and accumulating the account’s
transactions. Fraud management services monitor the
unauthorized use of accounts which have been
reported to be lost, stolen, or which exceed credit
limits. Fraud detection systems help identify
fraudulent transactions by monitoring each account
holder’s purchasing patterns and flagging unusual
purchases. Other services provided include
customized communications to cardholders,
information verification associated with granting
credit, debt collection, and customer service.
A summary of each segment’s results follows:
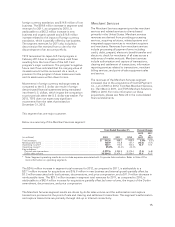
North America Services
The North America Services segment provides issuer
account solutions for financial institutions and other
organizations primarily based in North America. Growth
in revenues and operating profit in this segment is
derived from retaining and growing the core business
and improving the overall cost structure. Growing the
core business comes primarily from an increase in
account usage, growth from existing clients (also
referred to as organic growth) and sales to new clients
and the related account conversions.
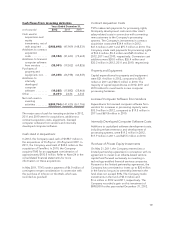
This segment has one major customer. Below is a
summary of the North America Services segment:
Years Ended
December 31, Percent Change
(in millions) 2012 2011 2010
2012
vs.
2011
2011
vs.
2010
Total revenues ......$ 965.4 954.6 956.5 1.1% (0.2)%
Reimbursable
items ............ 138.6 145.5 147.5 (4.7) (1.4)
Operating income* . . 287.6 253.8 245.0 13.3 3.6
Operating margin* . . . 29.8% 26.6% 25.6%
Key indicators:
AOF ............. 424.8 351.4 296.7 20.9 18.5
Transactions ...... 8,102.3 7,218.4 6,408.3 12.2 12.6
* Note: Segment operating results do not include
expenses associated with Corporate Administration.
Refer to Note 22 for more information on operating
segments.
The $10.8 million increase in segment total revenues
for 2012, as compared to 2011, is attributable to a
$67.3 million increase in new business and internal
growth partially offset by a $49.7 million decrease
related to client deconversions, price reductions and
termination fees and a $6.9 million decrease in
reimbursable items due to lost business. The
decrease related to price reductions includes a price
reduction related to a tiered-pricing arrangement
signed in the third quarter of 2012. The $1.9 million
decrease in segment total revenues in 2011 as
compared to 2010, is attributable to a $2.0 million
decrease in reimbursable items due to lost business
and a $55.9 million decrease related to client
deconversions, price reductions and termination fees.
This decrease was mostly offset by a $55.9 million
increase in new business and internal growth.
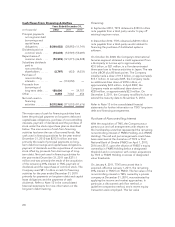
International Services
The International Services segment provides issuer
card solutions to financial institutions and other
organizations primarily based outside the North
America region. Growth in revenues and operating
profit in this segment is derived from retaining and
growing the core business and improving the overall
cost structure. Growing the core business comes
primarily from an increase in account usage, growth
from existing clients and sales to new clients and the
related account conversions.
This segment has one major customer.
Below is a summary of the International Services
segment:
Years Ended
December 31, Percent Change
(in millions) 2012 2011 2010
2012
vs.
2011
2011
vs.
2010
Total revenues ......$ 413.5 394.8 335.0 4.7% 17.9%
Reimbursable items . . 17.3 14.7 13.1 17.8 12.2
Operating income* . . 27.3 41.4 42.7 (34.0) (3.0)
Operating margin* . . . 6.6% 10.5% 12.7%
Key indicators:
AOF ............. 54.6 52.8 46.3 3.4 14.0
Transactions ...... 1,674.5 1,426.6 1,259.9 17.4 13.3
* Note: Segment operating results do not include expenses
associated with Corporate Administration. Refer to
Note 22 for more information on operating segments.
The $18.7 million increase in segment total revenues
for 2012, as compared to 2011, is attributable to a
$37.4 million increase in new business and organic
growth and an increase of $2.6 million in
reimbursable items, which is partially offset by a
decrease of $6.5 million related to the impact of
14