NetSpend 2012 Annual Report Download - page 32
Download and view the complete annual report
Please find page 32 of the 2012 NetSpend annual report below. You can navigate through the pages in the report by either clicking on the pages listed below, or by using the keyword search tool below to find specific information within the annual report.-
 1
1 -
2
-
3
-
4
-
5
-
6
-
7
-
8
-
9
-
10
-
11
-
12
-
13
-
14
-
15
-
16
-
17
-
18
-
19
-
20
-
21
-
 22
22 -
 23
23 -
 24
24 -
 25
25 -
 26
26 -
 27
27 -
 28
28 -
 29
29 -
 30
30 -
 31
31 -
 32
32 -
 33
33 -
 34
34 -
 35
35 -
 36
36 -
 37
37 -
 38
38 -
 39
39 -
 40
40 -
 41
41 -
 42
42 -
43
-
44
-
45
-
46
-
47
-
48
-
49
-
50
-
51
-
52
-
53
-
54
-
55
-
56
-
57
-
58
-
59
-
60
-
61
-
62
-
63
-
64
-
65
-
66
-
67
-
68
-
69
-
70
-
71
-
72
-
73
-
74
-
75
-
76
 |
 |

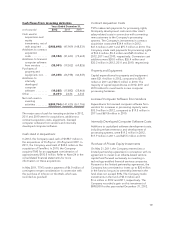
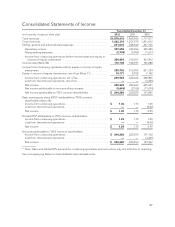
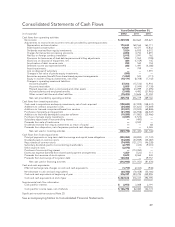
Consolidated Statements of Cash Flows
Years Ended December 31,
(in thousands) 2012 2011 2010
Cash flows from operating activities:
Net income ................................................................. $ 249,923 222,662 205,621
Adjustments to reconcile net income to net cash provided by operating activities:
Depreciation and amortization ................................................ 170,610 169,165 163,111
Share-based compensation .................................................. 18,621 16,477 15,832
Dividends received from equity investments .................................... 7,524 6,835 6,572
Charges for transaction processing provisions ................................... 2,803 4,750 3,891
Net loss on foreign currency translation ........................................ 2,012 3,091 162
Provisions for (recoveries of) bad debt expenses and billing adjustments ............ 1,054 1,552 (798)
(Gain) loss on disposal of equipment, net ....................................... 324 (1,159) 145
Amortization of debt issuance costs ........................................... 298 160 154
Deferred income tax expense (benefit) ......................................... 285 1,491 (4,388)
Asset impairments .......................................................... —799 —
Loss on disposal of subsidiary ................................................ —— 1,591
Changes in fair value of private equity investments ............................... (898) ——
Excess tax expense (benefit) from share-based payment arrangements .............. (1,259) 523 (111)
Equity in income of equity investments, net of tax ............................... (10,171) (8,708) (7,142)
Changes in operating assets and liabilities:
Accounts payable ........................................................ 37,206 (15,512) 13,916
Accounts receivable ...................................................... 2,855 (7,044) (7,138)
Prepaid expenses, other current assets and other assets ........................ (2,945) 23,099 (1,495)
Accrued salaries and employee benefits ...................................... (7,083) 4,492 (21,965)
Other current liabilities and other liabilities ................................... (15,406) 13,646 21,202
Net cash provided by operating activities .................................... 455,753 436,319 389,160
Cash flows from investing activities:
Cash used in acquisitions and equity investments, net of cash acquired ............... (188,698) (47,909) (148,531)
Additions to contract acquisition costs ........................................... (34,384) (31,623) (75,669)
Additions to licensed computer software from vendors ............................. (33,001) (19,502) (69,826)
Purchases of property and equipment ........................................... (31,395) (26,938) (46,547)
Additions to internally developed computer software .............................. (19,285) (17,882) (25,466)
Purchase of private equity investments ........................................... (3,031) (1,573) —
Subsidiary repurchase of noncontrolling interest ................................... —(493) —
Proceeds from sale of trade name ............................................... —4,500 —
Dividends received from equity investments as return of capital ...................... ——68
Proceeds from disposition, net of expenses paid and cash disposed .................. —— 4,265
Net cash used in investing activities ......................................... (309,794) (141,420) (361,706)
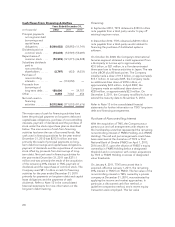
Cash flows from financing activities:
Principal payments on long-term debt borrowings and capital lease obligations ........ (200,052) (28,892) (11,741)
Dividends paid on common stock ............................................... (94,035) (53,949) (55,087)
Repurchases of common stock ................................................. (74,939) (121,271) (46,228)
Subsidiary dividends paid to noncontrolling shareholders ........................... (2,797) (433) (9,031)
Debt issuance costs .......................................................... (2,073) ——
Purchase of noncontrolling interest .............................................. —(174,050) —
Excess tax expense (benefit) from share-based payment arrangements ................ 1,259 (523) 111
Proceeds from exercise of stock options ......................................... 9,672 8,065 543
Proceeds from borrowings of long-term debt ..................................... 150,000 — 39,757
Net cash used in financing activities ......................................... (212,965) (371,053) (81,676)
Cash and cash equivalents:
Effect of exchange rate changes on cash and cash equivalents ....................... (1,719) (2,304) (938)
Net decrease in cash and cash equivalents ....................................... (68,725) (78,458) (55,160)
Cash and cash equivalents at beginning of year ................................... 316,337 394,795 449,955
Cash and cash equivalents at end of year ........................................ $ 247,612 316,337 394,795
Supplemental cash flow information:
Cash paid for interest ......................................................... $ 2,952 3,088 2,191
Cash paid for income taxes, net of refunds ....................................... $ 106,778 82,084 122,173
Significant noncash transactions (Note 23)
See accompanying Notes to Consolidated Financial Statements
29