NetSpend 2012 Annual Report Download - page 3
Download and view the complete annual report
Please find page 3 of the 2012 NetSpend annual report below. You can navigate through the pages in the report by either clicking on the pages listed below, or by using the keyword search tool below to find specific information within the annual report.-
 1
1 -
 2
2 -
 3
3 -
 4
4 -
 5
5 -
 6
6 -
 7
7 -
 8
8 -
 9
9 -
 10
10 -
 11
11 -
 12
12 -
 13
13 -
 14
14 -
15
-
16
-
17
-
18
-
19
-
20
-
21
-
22
-
23
-
24
-
25
-
26
-
27
-
28
-
29
-
30
-
31
-
32
-
33
-
34
-
35
-
36
-
37
-
38
-
39
-
40
-
41
-
42
-
43
-
44
-
45
-
46
-
47
-
48
-
49
-
50
-
51
-
52
-
53
-
54
-
55
-
56
-
57
-
58
-
59
-
60
-
61
-
62
-
63
-
64
-
65
-
66
-
67
-
68
-
69
-
70
-
71
-
72
-
73
-
74
-
75
-
76
 |
 |
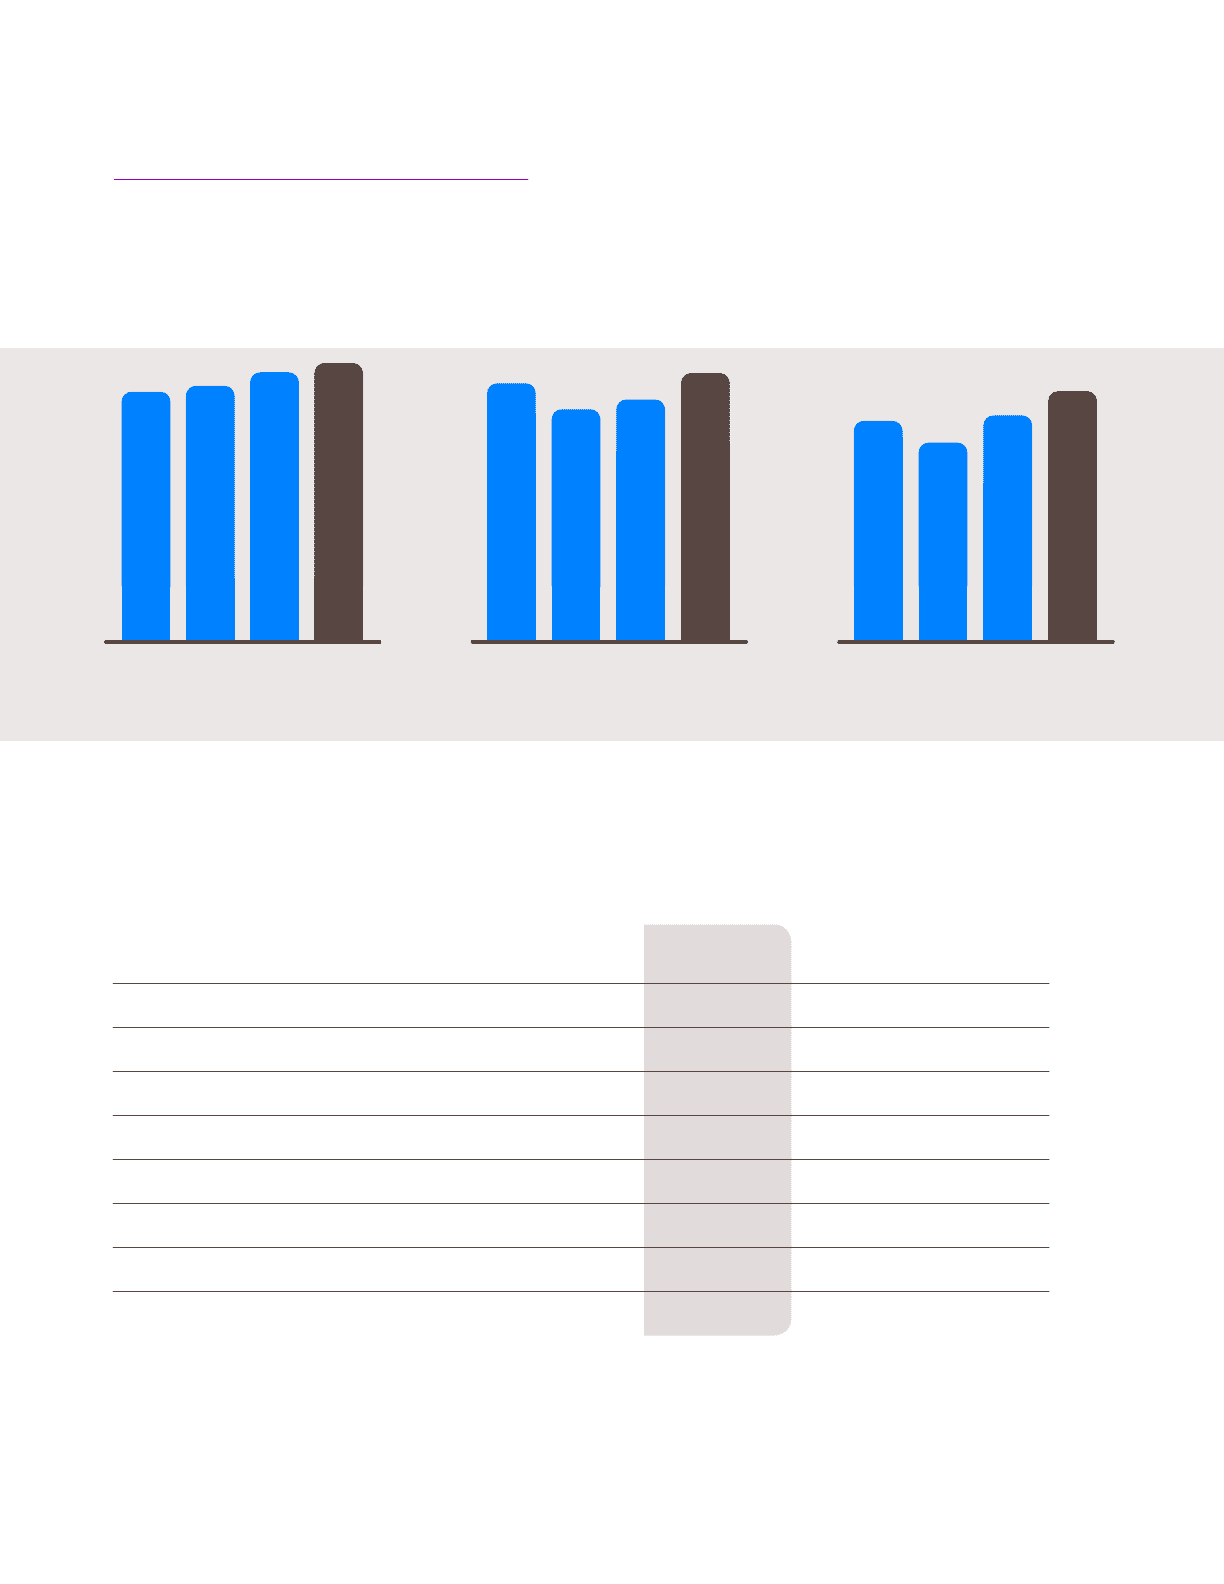
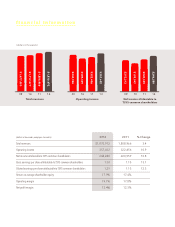
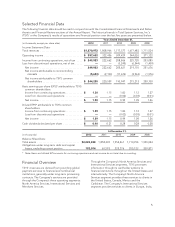
(dollars in thousands)
(dollars in thousands, except per share data)
Total revenues
Operating income
Net income attributable to TSYS common shareholders
Basic earnings per share attributable to TSYS common shareholders
Diluted earnings per share attributable to TSYS common shareholders
Return on average shareholder equity
Operating margin
Net profit margin
$1,870,972
357,652
244,280
1.30
1.29
17.9%
19.1%
13.4%
1,808,966
322,456
220,559
1.15
1.15
17.4%
17.8%
12.3%
3.4
10.9
10.8
13.1
12.5
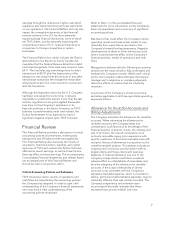
financial information
Total revenues
09 10 11 12 09 10 11 12 09 10 11 12
Operating income Net income attributable to
TSYS common shareholders
$357,652
$244,280
$1,870,972
$1,677,483
$1,808,966
$1,717,577
$322,456
$344,026
$309,429
$220,559
$215,213
$193,947
2012 2011 % Change
• View account status
• Purchase or sell shares
• View book-entry information
• Request certicate issuance
• Establish or change your PIN
• View payment history for dividends
• Make address changes
• Obtain a duplicate 1099 tax form
• Request a dividend check replacement
• Receive annual meeting materials electronically