LinkedIn 2012 Annual Report Download - page 97
Download and view the complete annual report
Please find page 97 of the 2012 LinkedIn annual report below. You can navigate through the pages in the report by either clicking on the pages listed below, or by using the keyword search tool below to find specific information within the annual report.-
 1
1 -
2
-
3
-
4
-
5
-
6
-
7
-
8
-
9
-
10
-
11
-
12
-
13
-
14
-
15
-
16
-
17
-
18
-
19
-
20
-
21
-
22
-
23
-
24
-
25
-
26
-
27
-
28
-
29
-
30
-
31
-
32
-
33
-
34
-
35
-
36
-
37
-
38
-
39
-
40
-
41
-
42
-
43
-
44
-
45
-
46
-
47
-
48
-
49
-
50
-
51
-
52
-
53
-
54
-
55
-
56
-
57
-
58
-
59
-
60
-
61
-
62
-
63
-
64
-
65
-
66
-
67
-
68
-
69
-
70
-
71
-
72
-
73
-
74
-
75
-
76
-
77
-
78
-
79
-
80
-
81
-
82
-
83
-
84
-
85
-
86
-
 87
87 -
 88
88 -
 89
89 -
 90
90 -
 91
91 -
 92
92 -
 93
93 -
 94
94 -
 95
95 -
 96
96 -
 97
97 -
 98
98 -
 99
99 -
 100
100 -
 101
101 -
 102
102 -
 103
103 -
 104
104 -
 105
105 -
 106
106 -
 107
107 -
108
-
109
-
110
 |
 |

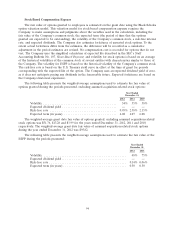
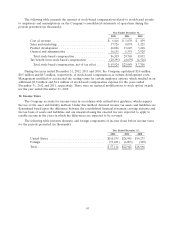
The following table presents the amount of stock-based compensation related to stock-based awards
to employees and nonemployees on the Company’s consolidated statements of operations during the
periods presented (in thousands):
Year Ended December 31,
2012 2011 2010
Cost of revenue .............................. $ 6,416 $ 1,678 $ 439
Sales and marketing ........................... 17,726 8,074 1,225
Product development .......................... 46,026 13,625 3,248
General and administrative ...................... 16,151 6,391 3,920
Total stock-based compensation ................. 86,319 29,768 8,832
Tax benefit from stock-based compensation .......... (20,395) (4,679) (1,526)
Total stock-based compensation, net of tax effect ..... $65,924 $25,089 $ 7,306
During the years ended December 31, 2012, 2011 and 2010, the Company capitalized $3.4 million,
$0.5 million and $0.3 million, respectively, of stock-based compensation as website development costs.
Management modified or accelerated the vesting terms for certain employee options, which resulted in an
additional $3.0 million and $1.4 million of stock-based compensation expense for the years ended
December 31, 2012 and 2011, respectively. There were no material modifications to stock option awards
for the year ended December 31, 2010.
12. Income Taxes
The Company accounts for income taxes in accordance with authoritative guidance, which requires
the use of the asset and liability method. Under this method, deferred income tax assets and liabilities are
determined based upon the difference between the consolidated financial statement carrying amounts and
the tax basis of assets and liabilities and are measured using the enacted tax rate expected to apply to
taxable income in the years in which the differences are expected to be reversed.
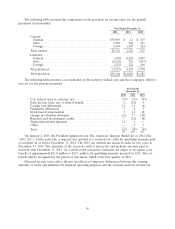
The following table presents domestic and foreign components of income (loss) before income taxes
for the periods presented (in thousands):
Year Ended December 31,
2012 2011 2010
United States ............................... $110,535 $28,945 $19,275
Foreign .................................... (53,421) (6,003) (309)
Total ...................................... $ 57,114 $22,942 $18,966
95