LinkedIn 2012 Annual Report Download - page 50
Download and view the complete annual report
Please find page 50 of the 2012 LinkedIn annual report below. You can navigate through the pages in the report by either clicking on the pages listed below, or by using the keyword search tool below to find specific information within the annual report.-
 1
1 -
2
-
3
-
4
-
5
-
6
-
7
-
8
-
9
-
10
-
11
-
12
-
13
-
14
-
15
-
16
-
17
-
18
-
19
-
20
-
21
-
22
-
23
-
24
-
25
-
26
-
27
-
28
-
29
-
30
-
31
-
32
-
33
-
34
-
35
-
36
-
37
-
38
-
39
-
 40
40 -
 41
41 -
 42
42 -
 43
43 -
 44
44 -
 45
45 -
 46
46 -
 47
47 -
 48
48 -
 49
49 -
 50
50 -
 51
51 -
 52
52 -
 53
53 -
 54
54 -
 55
55 -
 56
56 -
 57
57 -
 58
58 -
 59
59 -
 60
60 -
61
-
62
-
63
-
64
-
65
-
66
-
67
-
68
-
69
-
70
-
71
-
72
-
73
-
74
-
75
-
76
-
77
-
78
-
79
-
80
-
81
-
82
-
83
-
84
-
85
-
86
-
87
-
88
-
89
-
90
-
91
-
92
-
93
-
94
-
95
-
96
-
97
-
98
-
99
-
100
-
101
-
102
-
103
-
104
-
105
-
106
-
107
-
108
-
109
-
110
 |
 |

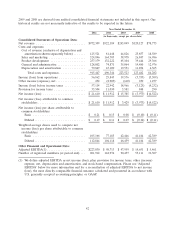
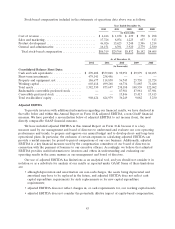
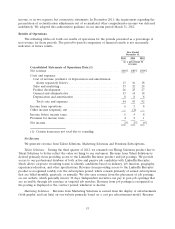
Adjusted EBITDA
To provide investors with additional information regarding our financial results, we have disclosed
within this Annual Report on Form 10-K adjusted EBITDA, a non-GAAP financial measure. We have
provided a reconciliation below of adjusted EBITDA to net income (loss), the most directly comparable
GAAP financial measure.
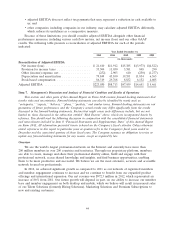
We have included adjusted EBITDA in this Annual Report on Form 10-K because it is a key
measure used by our management and board of directors to understand and evaluate our core operating
performance and trends, to prepare and approve our annual budget and to develop short- and long-term
operational plans. In particular, the exclusion of certain expenses in calculating adjusted EBITDA can
provide a useful measure for period-to-period comparisons of our core business. Additionally, adjusted
EBITDA is a key financial measure used by the compensation committee of our board of directors in
connection with the payment of bonuses to our executive officers. Accordingly, we believe that adjusted
EBITDA provides useful information to investors and others in understanding and evaluating our
operating results in the same manner as our management and board of directors.
For additional information on the limitations of adjusted EBITDA, see ‘‘Adjusted EBITDA’’ in Item 6
‘‘Selected Financial Data’’ for more information.
Year Ended December 31,
2012 2011 2010
(in thousands)
Reconciliation of Adjusted EBITDA:
Net income .............................................. $ 21,610 $11,912 $15,385
Provision for income taxes ................................... 35,504 11,030 3,581
Other (income) expense, net .................................. (252) 2,903 610
Depreciation and amortization ................................ 79,849 43,100 19,551
Stock-based compensation .................................... 86,319 29,768 8,832
Adjusted EBITDA ......................................... $223,030 $98,713 $47,959
Critical Accounting Policies and Estimates
Our consolidated financial statements are prepared in accordance with GAAP. The preparation of
these consolidated financial statements requires us to make estimates and assumptions that affect the
reported amounts of assets, liabilities, revenue, expenses and related disclosures. We evaluate our
estimates and assumptions on an ongoing basis. Our estimates are based on historical experience and
various other assumptions that we believe to be reasonable under the circumstances. Our actual results
could differ from these estimates.
We believe that the assumptions and estimates associated with revenue recognition, stock-based
compensation, the valuation of goodwill and intangible assets, website and internal-use software
development costs, leases, income taxes and legal contingencies have the greatest potential impact on our
consolidated financial statements. Therefore, we consider these to be our critical accounting policies and
estimates. For further information on all of our significant accounting policies, see Note 1 of the Notes to
Consolidated Financial Statements under Item 8.
Revenue Recognition
A majority of our arrangements for Talent Solutions and Marketing Solutions include multiple
deliverables. In accordance with authoritative guidance on revenue recognition, we allocate consideration
at the inception of an arrangement to all deliverables based on the relative selling price method in
accordance with the selling price hierarchy. The objective of the hierarchy is to determine the price at
which we would transact a sale if the service were sold on a stand-alone basis and requires the use of:
48