LinkedIn 2012 Annual Report Download - page 42
Download and view the complete annual report
Please find page 42 of the 2012 LinkedIn annual report below. You can navigate through the pages in the report by either clicking on the pages listed below, or by using the keyword search tool below to find specific information within the annual report.-
 1
1 -
2
-
3
-
4
-
5
-
6
-
7
-
8
-
9
-
10
-
11
-
12
-
13
-
14
-
15
-
16
-
17
-
18
-
19
-
20
-
21
-
22
-
23
-
24
-
25
-
26
-
27
-
28
-
29
-
30
-
31
-
 32
32 -
 33
33 -
 34
34 -
 35
35 -
 36
36 -
 37
37 -
 38
38 -
 39
39 -
 40
40 -
 41
41 -
 42
42 -
 43
43 -
 44
44 -
 45
45 -
 46
46 -
 47
47 -
 48
48 -
 49
49 -
 50
50 -
 51
51 -
 52
52 -
53
-
54
-
55
-
56
-
57
-
58
-
59
-
60
-
61
-
62
-
63
-
64
-
65
-
66
-
67
-
68
-
69
-
70
-
71
-
72
-
73
-
74
-
75
-
76
-
77
-
78
-
79
-
80
-
81
-
82
-
83
-
84
-
85
-
86
-
87
-
88
-
89
-
90
-
91
-
92
-
93
-
94
-
95
-
96
-
97
-
98
-
99
-
100
-
101
-
102
-
103
-
104
-
105
-
106
-
107
-
108
-
109
-
110
 |
 |

PART II
Item 5. Market for Registrant’s Common Equity, Related Stockholder Matters and Issuer Purchases of Equity
Securities
Our Class A common stock has been listed on the New York Stock Exchange (‘‘NYSE’’) under the
symbol ‘‘LNKD’’ since May 19, 2011. Prior to that date, there was no public trading market for our
Class A common stock. There is no public trading market for our Class B common stock. The following
table sets forth for the periods indicated the high and low sales price per share of our Class A common
stock as reported on the NYSE for the periods indicated:
2012 2011
High Low High Low
First Quarter ........................... $106.97 $61.28 n/a n/a
Second Quarter(1) ....................... 120.63 88.00 $122.70 $60.14
Third Quarter .......................... 125.50 91.67 115.05 70.04
Fourth Quarter ......................... 123.51 94.75 95.00 55.98
(1) The period reported for the second quarter of 2011 is from May 19, 2011 through June 30,
2011.
On December 31, 2012, the last reported sale price of our Class A common stock on the NYSE was
$114.82 per share. As of December 31, 2012, we had 138 holders of record of our Class A common stock
and 94 holders of record of our Class B common stock. The actual number of stockholders is greater than
this number of record holders, and includes stockholders who are beneficial owners, but whose shares are
held in street name by brokers and other nominees. This number of holders of record also does not
include stockholders whose shares may be held in trust by other entities.
We have never declared or paid, and do not anticipate declaring or paying, any cash dividends on our
capital stock. Any future determination as to the declaration and payment of dividends, if any, will be at
the discretion of our board of directors and will depend on then existing conditions, including our
financial condition, operating results, contractual restrictions, capital requirements, business prospects and
other factors our board of directors may deem relevant.
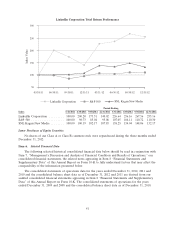
Performance Graph
This performance graph shall not be deemed ‘‘soliciting material’’ or to be ‘‘filed’’ with the Securities
and Exchange Commission for purposes of Section 18 of the Securities Exchange Act of 1934, as
amended, or the Exchange Act, or otherwise subject to the liabilities under that Section, and shall not be
deemed to be incorporated by reference into any filing of LinkedIn Corporation under the Securities Act
of 1933, as amended, or the Exchange Act.
The following graph shows a comparison from May 19, 2011 (the date our common stock commenced
trading on the NYSE) through December 31, 2012 of the cumulative total return for our Class A common
stock, the S&P 500 Index and the SNL Kagan New Media Index. Such returns are based on historical
results and are not intended to suggest future performance. Data for the S&P 500 Index and the SNL
Kagan New Media Index assume reinvestment of dividends.
40