LinkedIn 2012 Annual Report Download - page 66
Download and view the complete annual report
Please find page 66 of the 2012 LinkedIn annual report below. You can navigate through the pages in the report by either clicking on the pages listed below, or by using the keyword search tool below to find specific information within the annual report.-
 1
1 -
2
-
3
-
4
-
5
-
6
-
7
-
8
-
9
-
10
-
11
-
12
-
13
-
14
-
15
-
16
-
17
-
18
-
19
-
20
-
21
-
22
-
23
-
24
-
25
-
26
-
27
-
28
-
29
-
30
-
31
-
32
-
33
-
34
-
35
-
36
-
37
-
38
-
39
-
40
-
41
-
42
-
43
-
44
-
45
-
46
-
47
-
48
-
49
-
50
-
51
-
52
-
53
-
54
-
55
-
 56
56 -
 57
57 -
 58
58 -
 59
59 -
 60
60 -
 61
61 -
 62
62 -
 63
63 -
 64
64 -
 65
65 -
 66
66 -
 67
67 -
 68
68 -
 69
69 -
 70
70 -
 71
71 -
 72
72 -
 73
73 -
 74
74 -
 75
75 -
 76
76 -
77
-
78
-
79
-
80
-
81
-
82
-
83
-
84
-
85
-
86
-
87
-
88
-
89
-
90
-
91
-
92
-
93
-
94
-
95
-
96
-
97
-
98
-
99
-
100
-
101
-
102
-
103
-
104
-
105
-
106
-
107
-
108
-
109
-
110
 |
 |
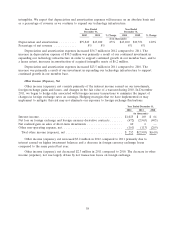
receivable was primarily due to our revenue growth in 2010 as compared to 2009. The increase in
accounts payable and accrued liabilities reflects timing of payments due to the growth in our business
activities. We had net income in 2010 of $15.4 million, which included non-cash depreciation and
amortization of $19.6 million and non-cash stock-based compensation of $8.8 million.
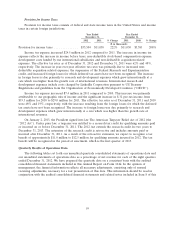
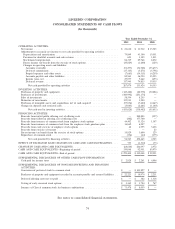
Investing Activities
Our primary investing activities have consisted of purchases of investments, purchases of property and
equipment specifically related to the build out of our data centers, as well as payments for intangible
assets and strategic acquisitions. We also continued to invest in technology hardware to support our
growth, software to support website functionality development, website operations and our corporate
infrastructure. Purchases of property and equipment may vary from period to period due to the timing of
the expansion of our operations and website and internal-use software development. We expect to
continue to invest in property and equipment and development of software in 2013. Our planned
purchases of property and equipment for 2013 are expected to be approximately $215.0 million.
In 2012, we had net purchases of investments of $245.5 million, purchases of property and equipment
of $125.4 million, and made payments for intangible assets and acquisitions, net of cash acquired, of
$57.0 million. In 2011, we had net purchases of investments of $239.4 million, purchases of property and
equipment of $89.0 million, and made payments for intangible assets and acquisitions, net of cash
acquired, of $7.4 million. In 2010, we had purchases of property and equipment of $50.0 million.
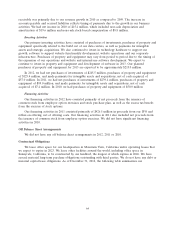
Financing Activities
Our financing activities in 2012 have consisted primarily of net proceeds from the issuance of
common stock from employee option exercises and stock purchase plan, as well as the excess tax benefit
from the exercise of stock options.
Our financing activities in 2011 consisted primarily of $426.5 million in proceeds from our IPO and
follow-on offering, net of offering costs. Our financing activities in 2011 also included net proceeds from
the issuance of common stock from employee option exercises. We did not have significant financing
activities in 2010.
Off Balance Sheet Arrangements
We did not have any off balance sheet arrangements in 2012, 2011 or 2010.
Contractual Obligations
We lease office space for our headquarters in Mountain View, California under operating leases that
we expect to expire in 2023. We lease other facilities around the world, including office space in
Sunnyvale, California, to be constructed by our landlord, the longest of which expires in 2026. We have
several material long-term purchase obligations outstanding with third parties. We do not have any debt or
material capital lease obligations. As of December 31, 2012, the following table summarizes our
64