LinkedIn 2012 Annual Report Download - page 64
Download and view the complete annual report
Please find page 64 of the 2012 LinkedIn annual report below. You can navigate through the pages in the report by either clicking on the pages listed below, or by using the keyword search tool below to find specific information within the annual report.-
 1
1 -
2
-
3
-
4
-
5
-
6
-
7
-
8
-
9
-
10
-
11
-
12
-
13
-
14
-
15
-
16
-
17
-
18
-
19
-
20
-
21
-
22
-
23
-
24
-
25
-
26
-
27
-
28
-
29
-
30
-
31
-
32
-
33
-
34
-
35
-
36
-
37
-
38
-
39
-
40
-
41
-
42
-
43
-
44
-
45
-
46
-
47
-
48
-
49
-
50
-
51
-
52
-
53
-
 54
54 -
 55
55 -
 56
56 -
 57
57 -
 58
58 -
 59
59 -
 60
60 -
 61
61 -
 62
62 -
 63
63 -
 64
64 -
 65
65 -
 66
66 -
 67
67 -
 68
68 -
 69
69 -
 70
70 -
 71
71 -
 72
72 -
 73
73 -
 74
74 -
75
-
76
-
77
-
78
-
79
-
80
-
81
-
82
-
83
-
84
-
85
-
86
-
87
-
88
-
89
-
90
-
91
-
92
-
93
-
94
-
95
-
96
-
97
-
98
-
99
-
100
-
101
-
102
-
103
-
104
-
105
-
106
-
107
-
108
-
109
-
110
 |
 |

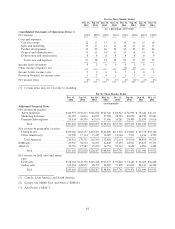
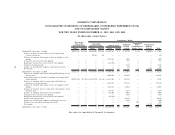
For the Three Months Ended
Dec 31, Sep 30, Jun 30, Mar 31, Dec 31, Sep 30, Jun 30, Mar 31,
2012 2012 2012 2012 2011 2011 2011 2011
(in thousands, except customer and headcount data)
Other Financial and
Operational Data:
Adjusted EBITDA(1) .... $ 78,587 $ 55,956 $ 50,369 $ 38,118 $ 34,424 $ 24,661 $ 26,346 $ 13,282
Number of registered
members (at period end) 201,912 187,419 173,945 160,566 144,974 131,186 115,808 101,528
LinkedIn Corporate
Solutions customers (at
period end)(2) ....... 16,409 13,991 12,283 10,531 9,236 7,366 6,072 4,774
Headcount (at period
end):
United States ........ 2,464 2,266 2,047 1,810 1,641 1,452 1,251 1,099
International ......... 994 911 814 637 475 345 264 189
Total ............. 3,458 3,177 2,861 2,447 2,116 1,797 1,515 1,288
(1) We define adjusted EBITDA as net income (loss), plus: provision (benefit) for income taxes, other
(income) expense, net, depreciation and amortization, and stock-based compensation. Please see
‘‘Adjusted EBITDA’’ in Item 6 ‘‘Selected Financial Data’’ for more information.
(2) During the first three quarters of 2012, we modified our methodology regarding customer count so
that customers were included after start of service of a contract, but we revised that methodology for
the fourth quarter of 2012 so that customers who are under contract are reflected in our count. To
enhance comparability, the number of customers for the first, second and third quarters of 2012 has
been recast to count customers upon entering into a contract, as opposed to the start of service.
For the Three Months Ended
Dec 31, Sep 30, Jun 30, Mar 31, Dec 31, Sep 30, Jun 30, Mar 31,
2012 2012 2012 2012 2011 2011 2011 2011
(in thousands)
Reconciliation of adjusted EBITDA:
Net income (loss) .............. $11,508 $ 2,302 $ 2,811 $ 4,989 $ 6,919 $(1,598) $ 4,513 $ 2,078
Provision (benefit) for income taxes 15,234 4,406 10,019 5,845 1,534 4,418 5,427 (349)
Other (income) expense, net ...... (24) (672) 668 (224) 1,575 1,788 (11) (449)
Depreciation and amortization .... 24,297 23,122 17,548 14,882 13,784 11,555 9,602 8,159
Stock-based compensation ....... 27,572 26,798 19,323 12,626 10,612 8,498 6,815 3,843
Adjusted EBITDA ............. $78,587 $55,956 $50,369 $38,118 $34,424 $24,661 $26,346 $13,282
62