LinkedIn 2012 Annual Report Download - page 56
Download and view the complete annual report
Please find page 56 of the 2012 LinkedIn annual report below. You can navigate through the pages in the report by either clicking on the pages listed below, or by using the keyword search tool below to find specific information within the annual report.-
 1
1 -
2
-
3
-
4
-
5
-
6
-
7
-
8
-
9
-
10
-
11
-
12
-
13
-
14
-
15
-
16
-
17
-
18
-
19
-
20
-
21
-
22
-
23
-
24
-
25
-
26
-
27
-
28
-
29
-
30
-
31
-
32
-
33
-
34
-
35
-
36
-
37
-
38
-
39
-
40
-
41
-
42
-
43
-
44
-
45
-
 46
46 -
 47
47 -
 48
48 -
 49
49 -
 50
50 -
 51
51 -
 52
52 -
 53
53 -
 54
54 -
 55
55 -
 56
56 -
 57
57 -
 58
58 -
 59
59 -
 60
60 -
 61
61 -
 62
62 -
 63
63 -
 64
64 -
 65
65 -
 66
66 -
67
-
68
-
69
-
70
-
71
-
72
-
73
-
74
-
75
-
76
-
77
-
78
-
79
-
80
-
81
-
82
-
83
-
84
-
85
-
86
-
87
-
88
-
89
-
90
-
91
-
92
-
93
-
94
-
95
-
96
-
97
-
98
-
99
-
100
-
101
-
102
-
103
-
104
-
105
-
106
-
107
-
108
-
109
-
110
 |
 |

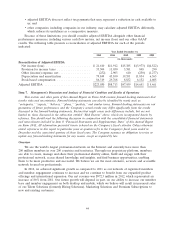
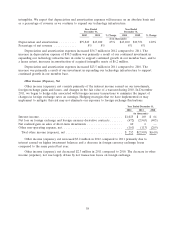
from internet advertising is recognized as the online advertisements are displayed on our website. The
typical duration of our advertising contracts is approximately two months.
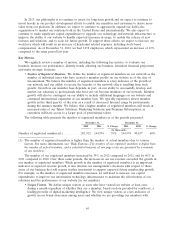
Premium Subscriptions. Revenue from Premium Subscriptions is derived from selling various
subscriptions to customers that allow users to have further access to premium services via our
LinkedIn.com website. We offer our members monthly or annual subscriptions. Revenue from Premium
Subscriptions is recognized ratably over the contract period, which is generally one to 12 months.
Year Ended Year Ended
December 31, December 31,
2012 2011 % Change 2011 2010 % Change
($ in thousands)
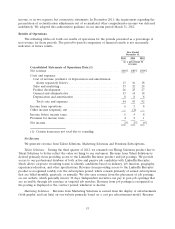
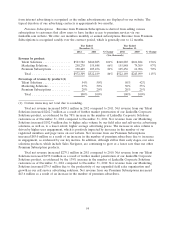
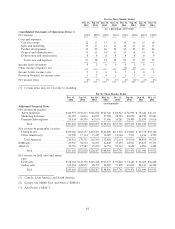
Revenue by product:
Talent Solutions ................ $523,582 $260,885 101% $260,885 $101,884 156%
Marketing Solutions ............. 258,278 155,848 66% 155,848 79,309 97%
Premium Subscriptions ........... 190,449 105,456 81% 105,456 61,906 70%
Total ...................... $972,309 $522,189 86% $522,189 $243,099 115%
Percentage of revenue by product:(1)
Talent Solutions ................ 54% 50% 50% 42%
Marketing Solutions ............. 27% 30% 30% 33%
Premium Subscriptions ........... 20% 20% 20% 25%
Total ...................... 100% 100% 100% 100%
(1) Certain items may not total due to rounding.
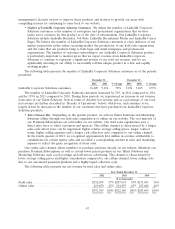
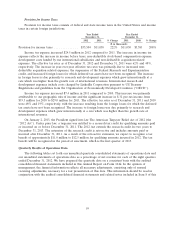
Total net revenue increased $450.1 million in 2012 compared to 2011. Net revenue from our Talent
Solutions increased $262.7 million as a result of further market penetration of our LinkedIn Corporate
Solutions product, as evidenced by the 78% increase in the number of LinkedIn Corporate Solutions
customers as of December 31, 2012 compared to December 31, 2011. Net revenue from our Marketing
Solutions increased $102.4 million due to higher sales volume by our field sales and self-service advertising
solutions, as well as, to a lesser extent, higher average advertising prices. The increase in sales volume is
driven by higher user engagement, which is positively impacted by increases in the number of our
registered members and page views on our website. Net revenue from our Premium Subscriptions
increased $85.0 million as a result of an increase in the number of premium subscribers due to increases
in engagement, as evidenced by our key metrics. In addition, although still in their early stages, our sales
solutions products, which include Sales Navigator, are continuing to grow at a faster rate than our other
Premium Subscription products.
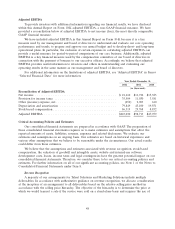
Total net revenue increased $279.1 million in 2011 compared to 2010. Net revenue from our Talent
Solutions increased $159.0 million as a result of further market penetration of our LinkedIn Corporate
Solutions product, as evidenced by the 139% increase in the number of LinkedIn Corporate Solutions
customers as of December 31, 2011 compared to December 31, 2010. Net revenue from our Marketing
Solutions increased $76.5 million due to the productivity of our expanded field sales organization and
growth in our self service advertising solutions. Net revenue from our Premium Subscriptions increased
$43.6 million as a result of an increase in the number of premium subscribers.
54