LinkedIn 2012 Annual Report Download - page 65
Download and view the complete annual report
Please find page 65 of the 2012 LinkedIn annual report below. You can navigate through the pages in the report by either clicking on the pages listed below, or by using the keyword search tool below to find specific information within the annual report.-
 1
1 -
2
-
3
-
4
-
5
-
6
-
7
-
8
-
9
-
10
-
11
-
12
-
13
-
14
-
15
-
16
-
17
-
18
-
19
-
20
-
21
-
22
-
23
-
24
-
25
-
26
-
27
-
28
-
29
-
30
-
31
-
32
-
33
-
34
-
35
-
36
-
37
-
38
-
39
-
40
-
41
-
42
-
43
-
44
-
45
-
46
-
47
-
48
-
49
-
50
-
51
-
52
-
53
-
54
-
 55
55 -
 56
56 -
 57
57 -
 58
58 -
 59
59 -
 60
60 -
 61
61 -
 62
62 -
 63
63 -
 64
64 -
 65
65 -
 66
66 -
 67
67 -
 68
68 -
 69
69 -
 70
70 -
 71
71 -
 72
72 -
 73
73 -
 74
74 -
 75
75 -
76
-
77
-
78
-
79
-
80
-
81
-
82
-
83
-
84
-
85
-
86
-
87
-
88
-
89
-
90
-
91
-
92
-
93
-
94
-
95
-
96
-
97
-
98
-
99
-
100
-
101
-
102
-
103
-
104
-
105
-
106
-
107
-
108
-
109
-
110
 |
 |

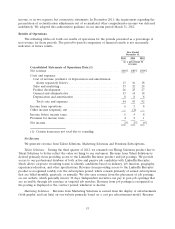
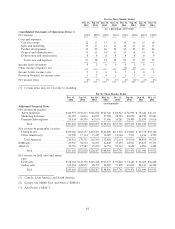
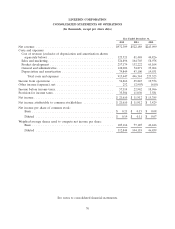
Liquidity and Capital Resources
Year Ended December 31,
2012 2011 2010
(in thousands)
Consolidated Statements of Cash Flows Data:
Purchases of property and equipment ........... $125,420 $ 88,978 $ 50,026
Depreciation and amortization ................ 79,849 43,100 19,551
Cash flows provided by operating activities ....... $267,070 $ 133,424 $ 54,353
Cash flows used in investing activities ........... (433,028) (338,482) (55,633)
Cash flows provided by financing activities ........ 96,563 452,465 4,325
As of December 31, 2012, we had cash and cash equivalents of $270.4 million and short-term
investments of $479.1 million. Our cash equivalents and short-term investments are comprised primarily of
money market funds, corporate debt securities, U.S. agency securities and U.S. treasury securities. As of
December 31, 2012, the amount of cash and cash equivalents held by foreign subsidiaries was
$76.9 million. If these funds are needed for our domestic operations, we would be required to accrue and
pay U.S. taxes to repatriate these funds. However, our intent is to permanently reinvest these funds
outside the U.S. and our current plans do not demonstrate a need to repatriate them to fund our
domestic operations. We do not provide for federal income taxes on the undistributed earnings of its
foreign subsidiaries. The income tax liability would be insignificant if these earnings were to be
repatriated. We believe that our existing cash and cash equivalents and short-term investment balances,
together with cash generated from operations, will be sufficient to meet our working capital expenditure
requirements for at least the next 12 months.
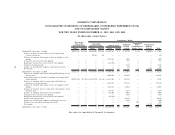
Operating Activities
Operating activities provided $267.1 million of cash in 2012, primarily resulting from our improved
operating performance as compared to the prior year. The cash flow from operating activities consisted
primarily of the changes in our operating assets and liabilities, with deferred revenue increasing
$117.9 million and accounts payable and other liabilities increasing $85.6 million, partially offset by an
increase in accounts receivable of $91.3 million, an increase in excess tax benefit from the exercise of
stock options of $35.8 million, which is reclassified as a financing activity, and an increase in prepaid
expenses and other assets of $7.7 million. The increases in our deferred revenue and accounts receivable
were primarily due to increases in transaction volumes in 2012 compared to 2011. We had net income in
2012 of $21.6 million, which included non-cash depreciation and amortization of $79.8 million and
non-cash stock-based compensation of $86.3 million.
Operating activities provided $133.4 million of cash in 2011, primarily resulting from our improved
operating performance as compared to the prior year. The cash flow from operating activities primarily
resulted from changes in our operating assets and liabilities, with deferred revenue increasing
$74.8 million and accounts payable and other liabilities increasing $37.0 million, partially offset by an
increase in accounts receivable of $54.9 million and an increase in prepaid expenses and other assets of
$14.1 million. The increases in our deferred revenue and accounts receivable were primarily due to our
revenue growth in 2011 as compared to 2010. We had net income in 2011 of $11.9 million, which included
non-cash depreciation and amortization of $43.1 million and non-cash stock-based compensation of
$29.8 million.
Operating activities provided $54.4 million of cash in 2010, primarily resulting from our improved
operating performance as compared to the prior year. The cash flow from operating activities primarily
resulted from changes in our operating assets and liabilities, with deferred revenue increasing
$39.5 million and accounts payable and accrued liabilities increasing $15.6 million, partially offset by an
increase in accounts receivable of $35.7 million. The increase in our deferred revenue and accounts
63