LinkedIn 2012 Annual Report Download - page 59
Download and view the complete annual report
Please find page 59 of the 2012 LinkedIn annual report below. You can navigate through the pages in the report by either clicking on the pages listed below, or by using the keyword search tool below to find specific information within the annual report.-
 1
1 -
2
-
3
-
4
-
5
-
6
-
7
-
8
-
9
-
10
-
11
-
12
-
13
-
14
-
15
-
16
-
17
-
18
-
19
-
20
-
21
-
22
-
23
-
24
-
25
-
26
-
27
-
28
-
29
-
30
-
31
-
32
-
33
-
34
-
35
-
36
-
37
-
38
-
39
-
40
-
41
-
42
-
43
-
44
-
45
-
46
-
47
-
48
-
 49
49 -
 50
50 -
 51
51 -
 52
52 -
 53
53 -
 54
54 -
 55
55 -
 56
56 -
 57
57 -
 58
58 -
 59
59 -
 60
60 -
 61
61 -
 62
62 -
 63
63 -
 64
64 -
 65
65 -
 66
66 -
 67
67 -
 68
68 -
 69
69 -
70
-
71
-
72
-
73
-
74
-
75
-
76
-
77
-
78
-
79
-
80
-
81
-
82
-
83
-
84
-
85
-
86
-
87
-
88
-
89
-
90
-
91
-
92
-
93
-
94
-
95
-
96
-
97
-
98
-
99
-
100
-
101
-
102
-
103
-
104
-
105
-
106
-
107
-
108
-
109
-
110
 |
 |

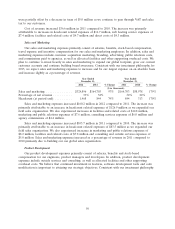
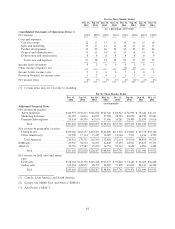
for 2013, we expect product development expense to increase on an absolute basis and decrease slightly as
a percentage of revenue.
Year Ended Year Ended
December 31, December 31,
2012 2011 % Change 2011 2010 % Change
($ in thousands)
Product development .............. $257,179 $132,222 95% $132,222 $65,104 103%
Percentage of net revenue ........... 26% 25% 25% 27%
Headcount (at period end): .......... 1,025 634 62% 634 383 66%
Product development expenses increased $125.0 million in 2012 compared to 2011. The increase was
primarily attributable to an increase in headcount related expenses of $101.4 million as a result of our
focus on developing new features and products to encourage member growth and engagement. We also
experienced increases in facilities and related costs of $10.5 million, consulting services of $7.7 million and
web hosting service expenses of $4.2 million.
Product development expenses increased $67.1 million in 2011 compared to 2010. The increase was
primarily attributable to an increase in headcount related expenses of $53.1 million as a result of our
focus on developing new features and products to increase member growth and engagement. We also
experienced increases in consulting expenses of $7.4 million and facilities and related costs of $3.9 million.
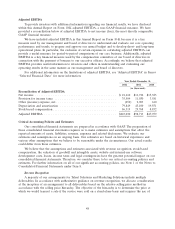
General and Administrative
Our general and administrative expenses primarily consist of salaries, benefits and stock-based
compensation for our executive, finance, legal, information technology, human resources and other
administrative employees. In addition, general and administrative expenses include outside consulting,
legal and accounting services, and facilities and other supporting overhead costs not allocated to other
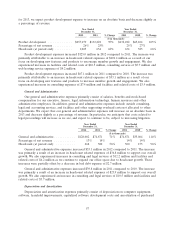
departments. We expect that our general and administrative expenses will increase on an absolute basis in
2013 and decrease slightly as a percentage of revenue. In particular, we anticipate that costs related to
legal proceedings will increase as we are, and expect to continue to be, subject to increasing litigation.
Year Ended Year Ended
December 31, December 31,
2012 2011 % Change 2011 2010 % Change
($ in thousands)
General and administrative ............ $128,002 $74,871 71% $74,871 $35,064 114%
Percentage of net revenue ............ 13% 14% 14% 14%
Headcount (at period end): ........... 468 300 56% 300 153 96%
General and administrative expenses increased $53.1 million in 2012 compared to 2011. The increase
was primarily a result of an increase in headcount related expenses of $36.8 million to support our overall
growth. We also experienced increases in consulting and legal services of $12.2 million and facilities and
related costs of $6.2 million as we continue to expand our office space due to headcount growth. These
increases were partially offset by a decrease in bad debt expense of $2.7 million.
General and administrative expenses increased $39.8 million in 2011 compared to 2010. The increase
was primarily a result of an increase in headcount related expenses of $23.9 million to support our overall
growth. We also experienced an increase in consulting and legal services of $10.5 million and facilities and
related costs of $3.7 million.
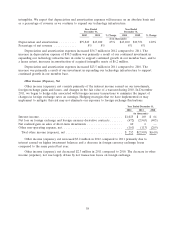
Depreciation and Amortization
Depreciation and amortization expenses primarily consist of depreciation on computer equipment,
software, leasehold improvements, capitalized software development costs and amortization of purchased
57