LinkedIn 2012 Annual Report Download - page 57
Download and view the complete annual report
Please find page 57 of the 2012 LinkedIn annual report below. You can navigate through the pages in the report by either clicking on the pages listed below, or by using the keyword search tool below to find specific information within the annual report.-
 1
1 -
2
-
3
-
4
-
5
-
6
-
7
-
8
-
9
-
10
-
11
-
12
-
13
-
14
-
15
-
16
-
17
-
18
-
19
-
20
-
21
-
22
-
23
-
24
-
25
-
26
-
27
-
28
-
29
-
30
-
31
-
32
-
33
-
34
-
35
-
36
-
37
-
38
-
39
-
40
-
41
-
42
-
43
-
44
-
45
-
46
-
 47
47 -
 48
48 -
 49
49 -
 50
50 -
 51
51 -
 52
52 -
 53
53 -
 54
54 -
 55
55 -
 56
56 -
 57
57 -
 58
58 -
 59
59 -
 60
60 -
 61
61 -
 62
62 -
 63
63 -
 64
64 -
 65
65 -
 66
66 -
 67
67 -
68
-
69
-
70
-
71
-
72
-
73
-
74
-
75
-
76
-
77
-
78
-
79
-
80
-
81
-
82
-
83
-
84
-
85
-
86
-
87
-
88
-
89
-
90
-
91
-
92
-
93
-
94
-
95
-
96
-
97
-
98
-
99
-
100
-
101
-
102
-
103
-
104
-
105
-
106
-
107
-
108
-
109
-
110
 |
 |

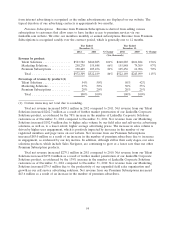
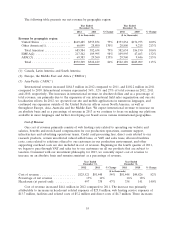
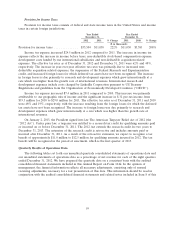
The following table presents our net revenue by geographic region:
Year Ended Year Ended
December 31, December 31,
2012 2011 % Change 2011 2010 % Change
($ in thousands) ($ in thousands)
Revenue by geographic region:
United States ................. $619,485 $353,834 75% $353,834 $176,975 100%
Other Americas(1) .............. 66,099 28,800 130% 28,800 9,215 213%
Total Americas ............... 685,584 382,634 79% 382,634 186,190 106%
EMEA(2) .................... 217,342 109,995 98% 109,995 47,463 132%
APAC(3) ..................... 69,383 29,560 135% 29,560 9,446 213%
Total ...................... $972,309 $522,189 86% $522,189 $243,099 115%
(1) Canada, Latin America and South America
(2) Europe, the Middle East and Africa (‘‘EMEA’’)
(3) Asia-Pacific (‘‘APAC’’)
International revenue increased $184.5 million in 2012 compared to 2011, and $102.2 million in 2011
compared to 2010. International revenue represented 36%, 32% and 27% of total revenue in 2012, 2011
and 2010, respectively. The increases in international revenue, in absolute dollars and as a percentage of
total revenue, are primarily due to the expansion of our international field sales organization and our site
localization efforts. In 2012, we operated our site and mobile applications in numerous languages, and
continued our expansion outside of the United States in offices across North America, as well as
throughout Europe, Asia, Australia and the Middle East. We expect international revenue to increase on
an absolute basis and as a percentage of revenue in 2013 as we continue to focus on making our platform
available in more languages and further developing our brand across various international geographies.
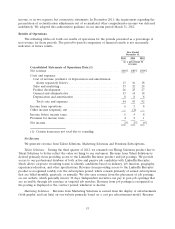
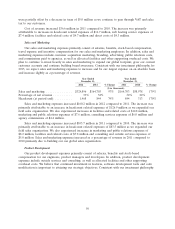
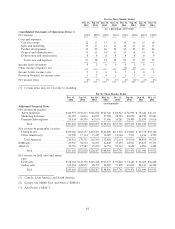
Cost of Revenue
Our cost of revenue primarily consists of web hosting costs related to operating our website and
salaries, benefits and stock-based compensation for our production operations, customer support,
infrastructure and advertising operations teams. Credit card processing fees, direct costs related to our
research products, certain uncollected valued added taxes, or VAT, and sales taxes, allocated facilities
costs, costs related to solutions offered to our customers in our production environment, and other
supporting overhead costs are also included in cost of revenue. Beginning in the fourth quarter of 2011,
we began to pass through VAT and sales tax to our customers on all our products that are subject to
taxation. Consistent with our investment philosophy for 2013, we currently expect cost of revenue to
increase on an absolute basis and remain consistent as a percentage of revenue.
Year Ended Year Ended
December 31, December 31,
2012 2011 % Change 2011 2010 % Change
($ in thousands)
Cost of revenue .................... $125,521 $81,448 54% $81,448 $44,826 82%
Percentage of net revenue ............ 13% 16% 16% 18%
Headcount (at period end): ........... 497 338 47% 338 141 140%
Cost of revenue increased $44.1 million in 2012 compared to 2011. The increase was primarily
attributable to increases in headcount related expenses of $25.8 million, web hosting service expenses of
$13.7 million, facilities and related costs of $5.2 million and direct costs of $4.7 million. These increases
55