LinkedIn 2012 Annual Report Download - page 88
Download and view the complete annual report
Please find page 88 of the 2012 LinkedIn annual report below. You can navigate through the pages in the report by either clicking on the pages listed below, or by using the keyword search tool below to find specific information within the annual report.-
 1
1 -
2
-
3
-
4
-
5
-
6
-
7
-
8
-
9
-
10
-
11
-
12
-
13
-
14
-
15
-
16
-
17
-
18
-
19
-
20
-
21
-
22
-
23
-
24
-
25
-
26
-
27
-
28
-
29
-
30
-
31
-
32
-
33
-
34
-
35
-
36
-
37
-
38
-
39
-
40
-
41
-
42
-
43
-
44
-
45
-
46
-
47
-
48
-
49
-
50
-
51
-
52
-
53
-
54
-
55
-
56
-
57
-
58
-
59
-
60
-
61
-
62
-
63
-
64
-
65
-
66
-
67
-
68
-
69
-
70
-
71
-
72
-
73
-
74
-
75
-
76
-
77
-
 78
78 -
 79
79 -
 80
80 -
 81
81 -
 82
82 -
 83
83 -
 84
84 -
 85
85 -
 86
86 -
 87
87 -
 88
88 -
 89
89 -
 90
90 -
 91
91 -
 92
92 -
 93
93 -
 94
94 -
 95
95 -
 96
96 -
 97
97 -
 98
98 -
99
-
100
-
101
-
102
-
103
-
104
-
105
-
106
-
107
-
108
-
109
-
110
 |
 |

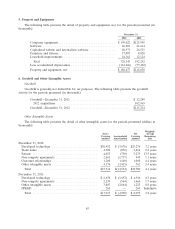
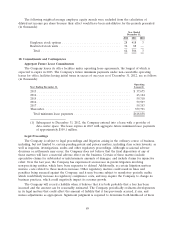
Amortization expense for the years ended December 31, 2012, 2011 and 2010 was $9.9 million,
$3.6 million and $1.0 million, respectively. Estimated future amortization of purchased intangible assets
for future periods is as follows (in thousands):
Years Ending December 31,
2013 ...................................................... $10,685
2014 ...................................................... 9,714
2015 ...................................................... 6,807
2016 ...................................................... 2,678
2017 ...................................................... 718
Thereafter ................................................. 2,061
Total .................................................... $32,663
7. Accrued Liabilities
The following table presents the detail of accrued liabilities for the periods presented (in thousands):
December 31,
2012 2011
Accrued vacation and employee-related expenses ............. $ 35,803 $15,709
Accrued incentives ................................... 46,554 24,600
Accrued sales tax and value-added taxes ................... 9,103 5,839
Exercise of unvested stock options ........................ 1,292 4,806
Other accrued expenses ............................... 11,325 7,690
Total ............................................ $104,077 $58,644
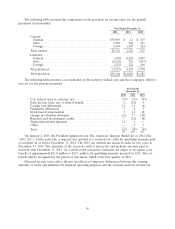
8. Other Income (Expense), Net
The following table presents the detail of other income (expense), net, for the periods presented (in
thousands):
Year Ended December 31,
2012 2011 2010
Interest income ................................. $1,025 $ 169 $ 64
Net loss on foreign exchange and foreign currency derivative
contracts ..................................... (672) (2,965) (405)
Net realized gain on sales of short-term investments ....... 60 6 —
Other non-operating expense, net .................... (161) (113) (269)
Total other income (expense), net .................. $ 252 $(2,903) $(610)
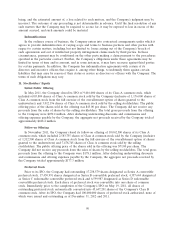
9. Income Per Share
Basic and diluted net income per common share is presented in conformity with the two-class method
required for participating securities. Immediately prior to the completion of the Company’s IPO on
May 19, 2011, all shares of outstanding preferred stock automatically converted into 45,647,201 shares of
our Class B common stock. Prior to the conversion of the preferred stock, holders of Series A and
Series B convertible preferred stock and Series C and D redeemable convertible preferred stock were
each entitled to receive non-cumulative dividends at the annual rate of $0.03, $0.05, $0.24 and $0.92 per
share per annum, respectively, payable prior and in preference to any dividends on any shares of the
Company’s common stock. In the event a dividend was paid on common stock, the holders of Series A
and Series B convertible preferred stock and Series C and D redeemable convertible preferred stock were
86