LinkedIn 2012 Annual Report Download - page 46
Download and view the complete annual report
Please find page 46 of the 2012 LinkedIn annual report below. You can navigate through the pages in the report by either clicking on the pages listed below, or by using the keyword search tool below to find specific information within the annual report.-
 1
1 -
2
-
3
-
4
-
5
-
6
-
7
-
8
-
9
-
10
-
11
-
12
-
13
-
14
-
15
-
16
-
17
-
18
-
19
-
20
-
21
-
22
-
23
-
24
-
25
-
26
-
27
-
28
-
29
-
30
-
31
-
32
-
33
-
34
-
35
-
 36
36 -
 37
37 -
 38
38 -
 39
39 -
 40
40 -
 41
41 -
 42
42 -
 43
43 -
 44
44 -
 45
45 -
 46
46 -
 47
47 -
 48
48 -
 49
49 -
 50
50 -
 51
51 -
 52
52 -
 53
53 -
 54
54 -
 55
55 -
 56
56 -
57
-
58
-
59
-
60
-
61
-
62
-
63
-
64
-
65
-
66
-
67
-
68
-
69
-
70
-
71
-
72
-
73
-
74
-
75
-
76
-
77
-
78
-
79
-
80
-
81
-
82
-
83
-
84
-
85
-
86
-
87
-
88
-
89
-
90
-
91
-
92
-
93
-
94
-
95
-
96
-
97
-
98
-
99
-
100
-
101
-
102
-
103
-
104
-
105
-
106
-
107
-
108
-
109
-
110
 |
 |

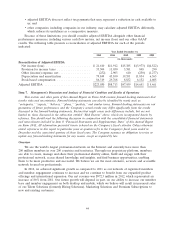
• adjusted EBITDA does not reflect tax payments that may represent a reduction in cash available to
us; and
• other companies, including companies in our industry, may calculate adjusted EBITDA differently,
which reduces its usefulness as a comparative measure.
Because of these limitations, you should consider adjusted EBITDA alongside other financial
performance measures, including various cash flow metrics, net income (loss) and our other GAAP
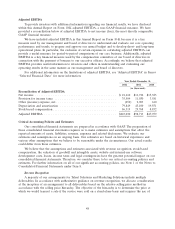
results. The following table presents a reconciliation of adjusted EBITDA for each of the periods
indicated:
Year Ended December 31,
2012 2011 2010 2009 2008
(in thousands)
Reconciliation of Adjusted EBITDA:
Net income (loss) ......................... $ 21,610 $11,912 $15,385 $ (3,973) $(4,522)
Provision for income taxes ................... 35,504 11,030 3,581 848 290
Other (income) expense, net .................. (252) 2,903 610 (230) (1,277)
Depreciation and amortization ................ 79,849 43,100 19,551 11,854 6,365
Stock-based compensation ................... 86,319 29,768 8,832 6,152 4,605
Adjusted EBITDA .......................... $223,030 $98,713 $47,959 $14,651 $ 5,461
Item 7. Management’s Discussion and Analysis of Financial Condition and Results of Operations
This section and other parts of this Annual Report on Form 10-K contain forward-looking statements that
involve risks and uncertainties. Forward-looking statements can also be identified by words such as
‘‘anticipates,’’ ‘‘expects,’’ ‘‘believes,’’ ‘‘plans,’’ ‘‘predicts,’’ and similar terms. Forward-looking statements are not
guarantees of future performance and the Company’s actual results may differ significantly from the results
discussed in the forward-looking statements. Factors that might cause such differences include, but are not
limited to, those discussed in the subsection entitled ‘‘Risk Factors’’ above, which are incorporated herein by
reference. You should read the following discussion in conjunction with the consolidated financial statements
and notes thereto included in Item 8 ‘‘Financial Statements and Supplementary Data’’ of this Annual Report
on Form 10-K. All information presented herein is based on the Company’s fiscal calendar. Unless otherwise
stated, references in this report to particular years or quarters refer to the Company’s fiscal years ended in
December and the associated quarters of those fiscal years. The Company assumes no obligation to revise or
update any forward-looking statements for any reason, except as required by law.
Overview
We are the world’s largest professional network on the Internet and currently have more than
200 million members in over 200 countries and territories. Through our proprietary platform, members
are able to create, manage and share their professional identity online, build and engage with their
professional network, access shared knowledge and insights, and find business opportunities, enabling
them to be more productive and successful. We believe we are the most extensive, accurate and accessible
network focused on professionals.
In 2012, we achieved significant growth as compared to 2011 as our network of registered members
and member engagement continues to increase and we continue to benefit from our expanded product
offerings and international expansion. Our net revenue was $972.3 million in 2012, which represented an
increase of 86% from 2011. Our future growth will depend, in part, on our ability to increase our member
base and member engagement on both desktop and mobile, which we believe will result in increased sales
of our Talent Solutions (formerly Hiring Solutions), Marketing Solutions and Premium Subscriptions to
new and existing customers.
44