LinkedIn 2012 Annual Report Download - page 48
Download and view the complete annual report
Please find page 48 of the 2012 LinkedIn annual report below. You can navigate through the pages in the report by either clicking on the pages listed below, or by using the keyword search tool below to find specific information within the annual report.-
 1
1 -
2
-
3
-
4
-
5
-
6
-
7
-
8
-
9
-
10
-
11
-
12
-
13
-
14
-
15
-
16
-
17
-
18
-
19
-
20
-
21
-
22
-
23
-
24
-
25
-
26
-
27
-
28
-
29
-
30
-
31
-
32
-
33
-
34
-
35
-
36
-
37
-
 38
38 -
 39
39 -
 40
40 -
 41
41 -
 42
42 -
 43
43 -
 44
44 -
 45
45 -
 46
46 -
 47
47 -
 48
48 -
 49
49 -
 50
50 -
 51
51 -
 52
52 -
 53
53 -
 54
54 -
 55
55 -
 56
56 -
 57
57 -
 58
58 -
59
-
60
-
61
-
62
-
63
-
64
-
65
-
66
-
67
-
68
-
69
-
70
-
71
-
72
-
73
-
74
-
75
-
76
-
77
-
78
-
79
-
80
-
81
-
82
-
83
-
84
-
85
-
86
-
87
-
88
-
89
-
90
-
91
-
92
-
93
-
94
-
95
-
96
-
97
-
98
-
99
-
100
-
101
-
102
-
103
-
104
-
105
-
106
-
107
-
108
-
109
-
110
 |
 |

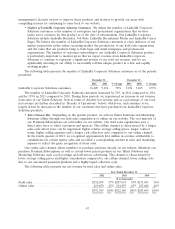
useful products and features, thereby increasing member engagement. We believe that a higher
level of member engagement will result in increased sales of our Talent Solutions, Marketing
Solutions and Premium Subscriptions, as customers will have access to a larger pool of professional
talent. Growth in unique visitors will be driven by our international expansion, growth in the
number of registered members and improvements to features and products that drive traffic to our
website.
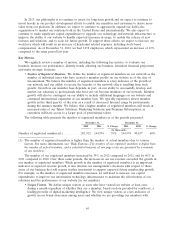
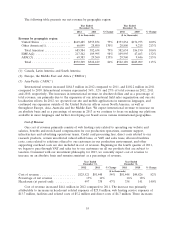
The following table presents the average monthly number of unique visitors during the periods
presented:
December 31, December 31,
2012 2011 % Change 2011 2010 % Change
(in millions)
Unique visitors(1) ............................ 126 84 50% 84 52 62%
(1) Includes the impact of Slideshare, which was acquired on May 17, 2012, beginning on June 1, 2012.
Excluding the impact of Slideshare, the average monthly number of unique visitors for the year ended
December 31, 2012 was 109 million.
The number of unique visitors increased by 50% in 2012 compared to 2011, and by 62% in 2011
compared to 2010. These increases reflect increased traffic to our website by a growing number of users.
While this increase in unique visitors helped to drive the increase in net revenue that we experienced
during this period, it also provided management with important insights into the ways in which our users
and members were using our website, including how they were coming to our website and which products
and features best promoted brand awareness to attract users to our website.
•Page Views. We define page views as the number of pages on our website that users view during
the measurement period based on data provided by comScore. Similar to unique visitors, we
believe page views is a key indicator for gaining insight into whether we are increasing member
engagement and whether our members are deriving value from our solutions. We expect growth in
page views will be driven, in part, by improvements in products and features that drive member
traffic to our website, growth in the number of registered members and international expansion.
However, page views may not capture all of the value that our members and other users derive
from our solutions because part of the benefit of certain products and features is that the member
or user does not need to visit our website to receive value from our platform. For example,
members can respond to emails they receive from other members without accessing their LinkedIn
account or our website.
The following table presents the number of page views during the periods presented:
December 31, December 31,
2012 2011 % Change 2011 2010 % Change
(in millions)
Page views(1) .......................... 38,258 29,420 30% 29,420 18,059 63%
(1) Includes the impact of Slideshare, which was acquired on May 17, 2012, beginning on June 1, 2012.
Excluding the impact of Slideshare, the number of page views for the year ended December 31, 2012
was 37 billion.
The number of page views according to comScore increased 30% in 2012 compared to 2011, and by
63% in 2011 compared to 2010. These increases reflect increased use of the information, products and
features available on our website by our users. While, similar to the increase in registered members and
unique visitors, this increase in page views also helped to drive the increase in net revenue that we
experienced during this period, it also provided management with important insights into the ways in
which our users were utilizing the information, products and features on our website, which informs
46