LinkedIn 2012 Annual Report Download - page 101
Download and view the complete annual report
Please find page 101 of the 2012 LinkedIn annual report below. You can navigate through the pages in the report by either clicking on the pages listed below, or by using the keyword search tool below to find specific information within the annual report.-
 1
1 -
2
-
3
-
4
-
5
-
6
-
7
-
8
-
9
-
10
-
11
-
12
-
13
-
14
-
15
-
16
-
17
-
18
-
19
-
20
-
21
-
22
-
23
-
24
-
25
-
26
-
27
-
28
-
29
-
30
-
31
-
32
-
33
-
34
-
35
-
36
-
37
-
38
-
39
-
40
-
41
-
42
-
43
-
44
-
45
-
46
-
47
-
48
-
49
-
50
-
51
-
52
-
53
-
54
-
55
-
56
-
57
-
58
-
59
-
60
-
61
-
62
-
63
-
64
-
65
-
66
-
67
-
68
-
69
-
70
-
71
-
72
-
73
-
74
-
75
-
76
-
77
-
78
-
79
-
80
-
81
-
82
-
83
-
84
-
85
-
86
-
87
-
88
-
89
-
90
-
 91
91 -
 92
92 -
 93
93 -
 94
94 -
 95
95 -
 96
96 -
 97
97 -
 98
98 -
 99
99 -
 100
100 -
 101
101 -
 102
102 -
 103
103 -
 104
104 -
 105
105 -
 106
106 -
 107
107 -
 108
108 -
 109
109 -
 110
110
 |
 |

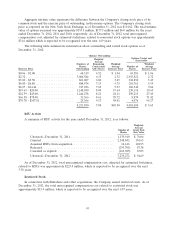
Year Ended December 31,
2012 2011 2010
Revenue by geographic region:
United States ............................ $619,485 $353,834 $176,975
Other Americas(1) .......................... 66,099 28,800 9,215
Total Americas ......................... 685,584 382,634 186,190
EMEA(2) ............................... 217,342 109,995 47,463
APAC(3) ............................... 69,383 29,560 9,446
Total ................................. $972,309 $522,189 $243,099
(1) Canada, Latin America and South America
(2) Europe, the Middle East and Africa (‘‘EMEA’’)
(3) Asia-Pacific (‘‘APAC’’)
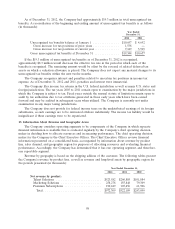
During the first quarter of 2012, the Company expanded its disclosure of international revenue to
provide further details of revenue by geographic region. During the third quarter of 2012, the Company
renamed its Hiring Solutions product line to Talent Solutions to better reflect the value the Company
brings to its customers.
No individual customer accounted for 10% or more of consolidated net revenue or accounts
receivable for any of the periods presented.
Long-Lived Assets
December 31,
2012 2011 2010
United States ............................... $172,278 $105,336 $54,454
Other Americas ............................. 1,071 807 19
Total Americas ............................ 173,349 106,143 54,473
EMEA ................................... 6,714 5,090 2,206
APAC .................................... 6,614 3,617 64
Total ................................... $186,677 $114,850 $56,743
14. Employee Benefit Plan
The Company has established a 401(k) tax-deferred savings plan covering all employees who satisfy
certain eligibility requirements. The 401(k) plan allows each participant to defer up to 75% of their
eligible compensation subject to applicable annual limits pursuant to the limits established by the Internal
Revenue Service. Effective January 1, 2011, the Company has elected to match any contributions made by
the employees, including executives, up to 1.5% of an employee’s total annual compensation up to the
annual limits established by the Internal Revenue Service. In the twelve months ended December 31, 2012
and 2011, matching contributions were $7.0 million and $3.3 million, respectively.
15. Subsequent Events
In February 2013, the Company entered into additional purchase commitments with a provider of
data center space for total future minimum payments of approximately $109.1 million over the next
11 years.
99