LinkedIn 2012 Annual Report Download - page 95
Download and view the complete annual report
Please find page 95 of the 2012 LinkedIn annual report below. You can navigate through the pages in the report by either clicking on the pages listed below, or by using the keyword search tool below to find specific information within the annual report.-
 1
1 -
2
-
3
-
4
-
5
-
6
-
7
-
8
-
9
-
10
-
11
-
12
-
13
-
14
-
15
-
16
-
17
-
18
-
19
-
20
-
21
-
22
-
23
-
24
-
25
-
26
-
27
-
28
-
29
-
30
-
31
-
32
-
33
-
34
-
35
-
36
-
37
-
38
-
39
-
40
-
41
-
42
-
43
-
44
-
45
-
46
-
47
-
48
-
49
-
50
-
51
-
52
-
53
-
54
-
55
-
56
-
57
-
58
-
59
-
60
-
61
-
62
-
63
-
64
-
65
-
66
-
67
-
68
-
69
-
70
-
71
-
72
-
73
-
74
-
75
-
76
-
77
-
78
-
79
-
80
-
81
-
82
-
83
-
84
-
 85
85 -
 86
86 -
 87
87 -
 88
88 -
 89
89 -
 90
90 -
 91
91 -
 92
92 -
 93
93 -
 94
94 -
 95
95 -
 96
96 -
 97
97 -
 98
98 -
 99
99 -
 100
100 -
 101
101 -
 102
102 -
 103
103 -
 104
104 -
 105
105 -
106
-
107
-
108
-
109
-
110
 |
 |

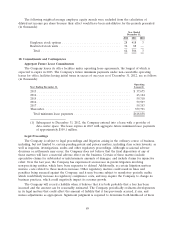
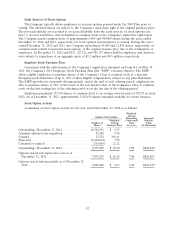
Aggregate intrinsic value represents the difference between the Company’s closing stock price of its
common stock and the exercise price of outstanding, in-the-money options. The Company’s closing stock
price as reported on the New York Stock Exchange as of December 31, 2012 was $114.82. The total intrinsic
value of options exercised was approximately $553.5 million, $177.5 million and $6.0 million for the years
ended December 31, 2012, 2011 and 2010, respectively. As of December 31, 2012, total unrecognized
compensation cost, adjusted for estimated forfeitures, related to nonvested stock options was approximately
$31.6 million which is expected to be recognized over the next 1.69 years.
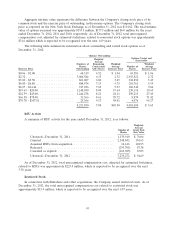
The following table summarizes information about outstanding and vested stock options as of
December 31, 2012:
Options Outstanding
Options Vested and
Weighted Exercisable
Average
Numbers of Remaining Weighted Weighted
Shares Contractual Average Number of Average
Exercise Price Outstanding Life (Years) Exercise Price Shares Exercise Price
$0.06 - $2.00 ..................... 68,519 4.52 $ 1.04 65,581 $ 1.06
$2.32 ........................... 3,066,584 6.15 2.32 2,915,821 2.32
$3.00 - $3.50 ..................... 861,087 6.80 3.49 218,898 3.49
$4.80 - $6.80 ..................... 888,474 7.13 5.75 201,761 5.59
$8.27 - $14.46 .................... 917,926 7.69 9.93 186,348 9.84
$19.63 - $20.00 .................... 1,148,050 8.09 19.64 230,114 19.63
$22.59 - $45.00 .................... 1,244,278 8.21 28.11 250,215 27.49
$66.38 - $78.08 .................... 31,566 8.61 70.72 8,874 71.42
$78.70 - $107.81 ................... 25,366 9.13 98.41 4,076 96.27
8,251,850 7.08 $10.50 4,081,688 $ 5.63
RSU Activity
A summary of RSU activity for the year ended December 31, 2012, is as follows:
Weighted-
Average
Number of Grant Date
Shares Fair Value
Unvested—December 31, 2011 ......................... 1,139,910 $ 76.04
Granted ......................................... 2,548,842 101.63
Assumed RSUs from acquisition ....................... 14,146 104.95
Released ......................................... (293,701) 87.38
Canceled or expired ................................ (169,925) 87.05
Unvested—December 31, 2012 ......................... 3,239,272 $ 94.69
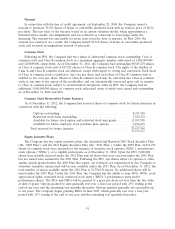
As of December 31, 2012, total unrecognized compensation cost, adjusted for estimated forfeitures,
related to RSUs was approximately $225.4 million, which is expected to be recognized over the next
3.38 years.
Restricted Stock
In connection with Slideshare and other acquisitions, the Company issued restricted stock. As of
December 31, 2012, the total unrecognized compensation cost related to restricted stock was
approximately $15.9 million, which is expected to be recognized over the next 1.07 years.
93