LinkedIn 2012 Annual Report Download - page 49
Download and view the complete annual report
Please find page 49 of the 2012 LinkedIn annual report below. You can navigate through the pages in the report by either clicking on the pages listed below, or by using the keyword search tool below to find specific information within the annual report.-
 1
1 -
2
-
3
-
4
-
5
-
6
-
7
-
8
-
9
-
10
-
11
-
12
-
13
-
14
-
15
-
16
-
17
-
18
-
19
-
20
-
21
-
22
-
23
-
24
-
25
-
26
-
27
-
28
-
29
-
30
-
31
-
32
-
33
-
34
-
35
-
36
-
37
-
38
-
 39
39 -
 40
40 -
 41
41 -
 42
42 -
 43
43 -
 44
44 -
 45
45 -
 46
46 -
 47
47 -
 48
48 -
 49
49 -
 50
50 -
 51
51 -
 52
52 -
 53
53 -
 54
54 -
 55
55 -
 56
56 -
 57
57 -
 58
58 -
 59
59 -
60
-
61
-
62
-
63
-
64
-
65
-
66
-
67
-
68
-
69
-
70
-
71
-
72
-
73
-
74
-
75
-
76
-
77
-
78
-
79
-
80
-
81
-
82
-
83
-
84
-
85
-
86
-
87
-
88
-
89
-
90
-
91
-
92
-
93
-
94
-
95
-
96
-
97
-
98
-
99
-
100
-
101
-
102
-
103
-
104
-
105
-
106
-
107
-
108
-
109
-
110
 |
 |

management’s decision on how to improve these products and features to provide our users with
compelling reasons for continuing to come back to our website.
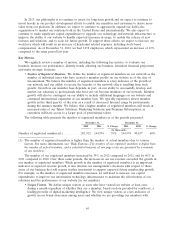
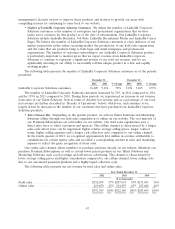
•Number of LinkedIn Corporate Solutions Customers. We define the number of LinkedIn Corporate
Solutions customers as the number of enterprises and professional organizations that we have
under active contracts for this product as of the date of measurement. Our LinkedIn Corporate
Solutions include LinkedIn Recruiter, Job Slots, LinkedIn Recruitment Media and LinkedIn Career
Pages. We believe the number of LinkedIn Corporate Solutions customers is a key indicator of our
market penetration in the online recruiting market, the productivity of our field sales organization
and the value that our products bring to both large and small enterprises and professional
organizations. The number of customers subscribing to our LinkedIn Corporate Solutions product
is particularly important to monitor given that we expect revenue from LinkedIn Corporate
Solutions to continue to represent a significant portion of our total net revenue, and we are
significantly investing in our ability to successfully sell this unique product in a new and rapidly
evolving market.
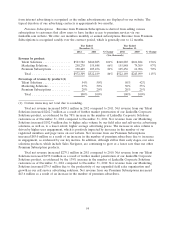
The following table presents the number of LinkedIn Corporate Solutions customers as of the periods
presented:
December 31, December 31,
2012 2011 % Change 2011 2010 % Change
LinkedIn Corporate Solutions customers ......... 16,409 9,236 78% 9,236 3,865 139%
The number of LinkedIn Corporate Solutions customers increased by 78% in 2012 compared to 2011,
and by 139% in 2011 compared to 2010. During these periods, we experienced an increase in net revenue
from sales of our Talent Solutions, both in terms of absolute net revenue and as a percentage of our total
net revenue (as further described in ‘‘Results of Operations’’ below), which was, and continues to be,
largely driven by increases in the number of our customers that have purchased our LinkedIn Corporate
Solutions products.
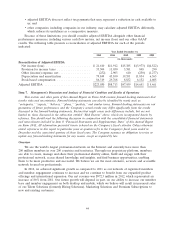
•Sales Channel Mix. Depending on the specific product, we sell our Talent Solutions and Marketing
Solutions offline through our field sales organization or online on our website. The vast majority of
our Premium Subscriptions are sold online on our website. Our field sales organization uses a
direct sales force to solicit customers and agencies. This offline channel is characterized by a longer
sales cycle where price can be negotiated, higher relative average selling prices, longer contract
terms, higher selling expenses and a longer cash collection cycle compared to our online channel.
In the fourth quarter of 2012, we recognized approximately $4.4 million in revenue attributable to
commissions for certain agency sales and recorded a corresponding amount in sales and marketing
expense to reflect the gross recognition of these sales.
Our online sales channel allows members to purchase solutions directly on our website. Members can
purchase Premium Subscriptions as well as certain lower priced products in our Talent Solutions and
Marketing Solutions, such as job postings and self-service advertising. This channel is characterized by
lower average selling prices and higher cancellations compared to our offline channel, lower selling costs
due to our automated payments platform and a highly liquid collection cycle.
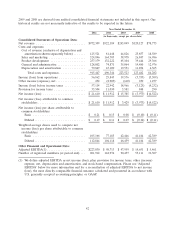
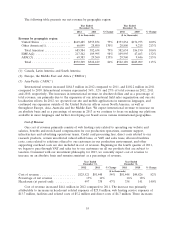
The following table presents our net revenue by field sales and online sales:
Year Ended December 31,
2012 2011 2010
($ in thousands)
Field sales ................................ $552,459 57% $287,634 55% $135,691 56%
Online sales ............................... 419,850 43% 234,555 45% 107,408 44%
$972,309 100% $522,189 100% $243,099 100%
47