LinkedIn 2012 Annual Report Download - page 60
Download and view the complete annual report
Please find page 60 of the 2012 LinkedIn annual report below. You can navigate through the pages in the report by either clicking on the pages listed below, or by using the keyword search tool below to find specific information within the annual report.-
 1
1 -
2
-
3
-
4
-
5
-
6
-
7
-
8
-
9
-
10
-
11
-
12
-
13
-
14
-
15
-
16
-
17
-
18
-
19
-
20
-
21
-
22
-
23
-
24
-
25
-
26
-
27
-
28
-
29
-
30
-
31
-
32
-
33
-
34
-
35
-
36
-
37
-
38
-
39
-
40
-
41
-
42
-
43
-
44
-
45
-
46
-
47
-
48
-
49
-
 50
50 -
 51
51 -
 52
52 -
 53
53 -
 54
54 -
 55
55 -
 56
56 -
 57
57 -
 58
58 -
 59
59 -
 60
60 -
 61
61 -
 62
62 -
 63
63 -
 64
64 -
 65
65 -
 66
66 -
 67
67 -
 68
68 -
 69
69 -
 70
70 -
71
-
72
-
73
-
74
-
75
-
76
-
77
-
78
-
79
-
80
-
81
-
82
-
83
-
84
-
85
-
86
-
87
-
88
-
89
-
90
-
91
-
92
-
93
-
94
-
95
-
96
-
97
-
98
-
99
-
100
-
101
-
102
-
103
-
104
-
105
-
106
-
107
-
108
-
109
-
110
 |
 |

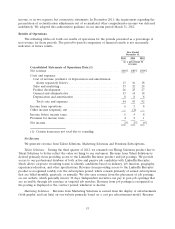
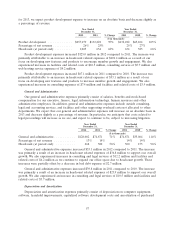
intangibles. We expect that depreciation and amortization expenses will increase on an absolute basis and
as a percentage of revenue as we continue to expand our technology infrastructure.
Year Ended Year Ended
December 31, December 31,
2012 2011 % Change 2011 2010 % Change
($ in thousands)
Depreciation and amortization .......... $79,849 $43,100 85% $43,100 $19,551 120%
Percentage of net revenue ............. 8% 8% 8% 8%
Depreciation and amortization expenses increased $36.7 million in 2012 compared to 2011. The
increase in depreciation expense of $30.5 million was primarily a result of our continued investment in
expanding our technology infrastructure in order to support continued growth in our member base, and to
a lesser extent, increases in amortization of acquired intangible assets of $6.2 million.
Depreciation and amortization expenses increased $23.5 million in 2011 compared to 2010. The
increase was primarily a result of our investment in expanding our technology infrastructure to support
continued growth in our member base.
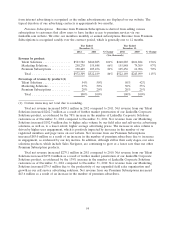
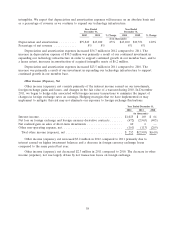
Other Income (Expense), Net
Other income (expense), net consists primarily of the interest income earned on our investments,
foreign exchange gains and losses, and changes in the fair value of a warrant during 2010. In December
2011, we began to hedge risks associated with foreign currency transactions to minimize the impact of
changes in foreign exchange rates on earnings. Hedging strategies that we have implemented or may
implement to mitigate this risk may not eliminate our exposure to foreign exchange fluctuations.
Year Ended December 31,
2012 2011 2010
(in thousands)
Interest income ............................................... $1,025 $ 169 $ 64
Net loss on foreign exchange and foreign currency derivative contracts ....... (672) (2,965) (405)
Net realized gain on sales of short-term investments .................... 60 6 —
Other non-operating expense, net .................................. (161) (113) (269)
Total other income (expense), net ................................ $ 252 $(2,903) $(610)
Other income (expense), net increased $3.2 million in 2012 compared to 2011 primarily due to
interest earned on higher investment balances and a decrease in foreign currency exchange losses
compared to the same period last year.
Other income (expense), net decreased $2.3 million in 2011 compared to 2010. The decrease in other
income (expense), net was largely driven by net transaction losses on foreign exchange.
58