LinkedIn 2012 Annual Report Download - page 100
Download and view the complete annual report
Please find page 100 of the 2012 LinkedIn annual report below. You can navigate through the pages in the report by either clicking on the pages listed below, or by using the keyword search tool below to find specific information within the annual report.-
 1
1 -
2
-
3
-
4
-
5
-
6
-
7
-
8
-
9
-
10
-
11
-
12
-
13
-
14
-
15
-
16
-
17
-
18
-
19
-
20
-
21
-
22
-
23
-
24
-
25
-
26
-
27
-
28
-
29
-
30
-
31
-
32
-
33
-
34
-
35
-
36
-
37
-
38
-
39
-
40
-
41
-
42
-
43
-
44
-
45
-
46
-
47
-
48
-
49
-
50
-
51
-
52
-
53
-
54
-
55
-
56
-
57
-
58
-
59
-
60
-
61
-
62
-
63
-
64
-
65
-
66
-
67
-
68
-
69
-
70
-
71
-
72
-
73
-
74
-
75
-
76
-
77
-
78
-
79
-
80
-
81
-
82
-
83
-
84
-
85
-
86
-
87
-
88
-
89
-
 90
90 -
 91
91 -
 92
92 -
 93
93 -
 94
94 -
 95
95 -
 96
96 -
 97
97 -
 98
98 -
 99
99 -
 100
100 -
 101
101 -
 102
102 -
 103
103 -
 104
104 -
 105
105 -
 106
106 -
 107
107 -
 108
108 -
 109
109 -
 110
110
 |
 |

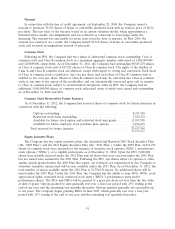
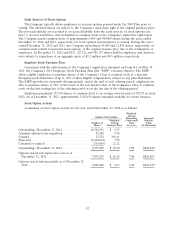
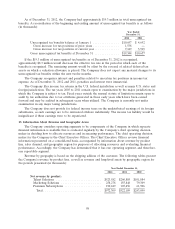
As of December 31, 2012, the Company had approximately $19.3 million in total unrecognized tax
benefits. A reconciliation of the beginning and ending amount of unrecognized tax benefits is as follows
(in thousands):
Year Ended
December 31,
2012 2011
Unrecognized tax benefits balance at January 1 ............... $10,657 $ 4,692
Gross increase for tax positions of prior years ............... 1,538 —
Gross increase for tax positions of current year .............. 7,149 5,965
Gross unrecognized tax benefits at December 31 .............. $19,344 $10,657
If the $19.3 million of unrecognized tax benefits as of December 31, 2012 is recognized,
approximately $8.3 million would decrease the effective tax rate in the period in which each of the
benefits is recognized. The remaining amount would be offset by the reversal of related deferred tax
assets on which a valuation allowance is placed. The Company does not expect any material changes to its
unrecognized tax benefits within the next twelve months.
The Company recognizes interest and penalties related to uncertain tax positions in income tax
expense. As of December 31, 2012 and 2011, penalties and interest were immaterial.
The Company files income tax returns in the U.S. federal jurisdiction as well as many U.S. states and
foreign jurisdictions. The tax years 2003 to 2011 remain open to examination by the major jurisdictions in
which the Company is subject to tax. Fiscal years outside the normal statute of limitation remain open to
audit by tax authorities due to tax attributes generated in those early years which have been carried
forward and may be audited in subsequent years when utilized. The Company is currently not under
examination in any major taxing jurisdictions.
The Company does not provide for federal income taxes on the undistributed earnings of its foreign
subsidiaries, as such earnings are to be reinvested offshore indefinitely. The income tax liability would be
insignificant if these earnings were to be repatriated.
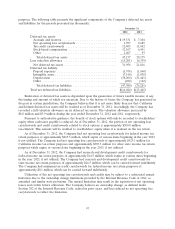
13. Information About Revenue and Geographic Areas
The Company considers operating segments to be components of the Company in which separate
financial information is available that is evaluated regularly by the Company’s chief operating decision
maker in deciding how to allocate resources and in assessing performance. The chief operating decision
maker for the Company is the Chief Executive Officer. The Chief Executive Officer reviews financial
information presented on a consolidated basis, accompanied by information about revenue by product
line, sales channel, and geographic region for purposes of allocating resources and evaluating financial
performance. Accordingly, the Company has determined that it has one operating segment, and therefore,
one reportable segment.
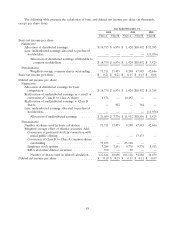
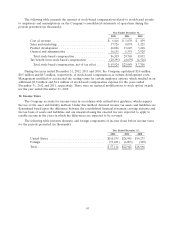
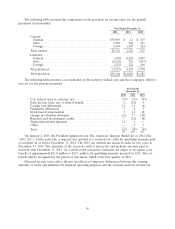
Revenue by geography is based on the shipping address of the customer. The following tables present
the Company’s revenue by product line, as well as revenue and long-lived assets by geographic region for
the periods presented (in thousands):
Year Ended December 31,
2012 2011 2010
Net revenue by product:
Talent Solutions .......................... $523,582 $260,885 $101,884
Marketing Solutions ....................... 258,278 155,848 79,309
Premium Subscriptions ..................... 190,449 105,456 61,906
Total ................................. $972,309 $522,189 $243,099
98