LinkedIn 2012 Annual Report Download - page 76
Download and view the complete annual report
Please find page 76 of the 2012 LinkedIn annual report below. You can navigate through the pages in the report by either clicking on the pages listed below, or by using the keyword search tool below to find specific information within the annual report.-
 1
1 -
2
-
3
-
4
-
5
-
6
-
7
-
8
-
9
-
10
-
11
-
12
-
13
-
14
-
15
-
16
-
17
-
18
-
19
-
20
-
21
-
22
-
23
-
24
-
25
-
26
-
27
-
28
-
29
-
30
-
31
-
32
-
33
-
34
-
35
-
36
-
37
-
38
-
39
-
40
-
41
-
42
-
43
-
44
-
45
-
46
-
47
-
48
-
49
-
50
-
51
-
52
-
53
-
54
-
55
-
56
-
57
-
58
-
59
-
60
-
61
-
62
-
63
-
64
-
65
-
 66
66 -
 67
67 -
 68
68 -
 69
69 -
 70
70 -
 71
71 -
 72
72 -
 73
73 -
 74
74 -
 75
75 -
 76
76 -
 77
77 -
 78
78 -
 79
79 -
 80
80 -
 81
81 -
 82
82 -
 83
83 -
 84
84 -
 85
85 -
 86
86 -
87
-
88
-
89
-
90
-
91
-
92
-
93
-
94
-
95
-
96
-
97
-
98
-
99
-
100
-
101
-
102
-
103
-
104
-
105
-
106
-
107
-
108
-
109
-
110
 |
 |

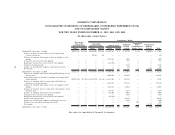
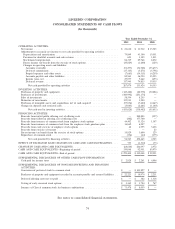
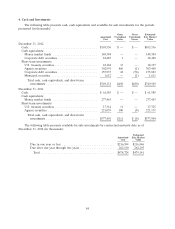
LINKEDIN CORPORATION
CONSOLIDATED STATEMENTS OF CASH FLOWS
(In thousands)
Year Ended December 31,
2012 2011 2010
OPERATING ACTIVITIES:
Net income .................................................... $ 21,610 $ 11,912 $ 15,385
Adjustments to reconcile net income to net cash provided by operating activities:
Depreciation and amortization ....................................... 79,849 43,100 19,551
Provision for doubtful accounts and sales returns ........................... 623 3,109 1,811
Stock-based compensation ......................................... 86,319 29,768 8,832
Excess income tax benefit from the exercise of stock options .................... (35,829) (1,600) (129)
Changes in operating assets and liabilities:
Accounts receivable ............................................ (91,277) (54,908) (35,677)
Deferred commissions ........................................... (17,145) (5,271) (5,798)
Prepaid expenses and other assets ................................... (7,663) (14,111) (4,259)
Accounts payable and other liabilities ................................. 85,561 36,950 15,595
Income taxes, net .............................................. 27,077 9,662 (493)
Deferred revenue .............................................. 117,945 74,813 39,535
Net cash provided by operating activities ............................. 267,070 133,424 54,353
INVESTING ACTIVITIES:
Purchases of property and equipment .................................... (125,420) (88,978) (50,026)
Purchases of investments ............................................ (443,992) (251,174) —
Sales of investments ............................................... 58,594 8,255 —
Maturities of investments ............................................ 139,911 3,500 —
Purchases of intangible assets and acquisitions, net of cash acquired ................ (57,036) (7,404) (4,467)
Changes in deposits and restricted cash ................................... (5,085) (2,681) (1,140)
Net cash used in investing activities ................................. (433,028) (338,482) (55,633)
FINANCING ACTIVITIES:
Proceeds from initial public offering, net of offering costs ....................... — 248,803 (397)
Proceeds from follow-on offering, net of offering costs ......................... (382) 177,700 —
Proceeds from issuance of common stock from employee stock options .............. 44,402 13,124 1,307
Proceeds from issuance of common stock from the employee stock purchase plan ........ 16,862 6,287 —
Proceeds from early exercise of employee stock options ........................ 48 4,995 3,438
Proceeds from exercise of warrant ...................................... — — 23
Excess income tax benefit from the exercise of stock options ..................... 35,829 1,600 129
Repurchase of common stock ......................................... (196) (44) (175)
Net cash provided by financing activities .............................. 96,563 452,465 4,325
EFFECT OF EXCHANGE RATE CHANGES ON CASH AND CASH EQUIVALENTS .... 755 (1,310) (73)
CHANGE IN CASH AND CASH EQUIVALENTS ............................ (68,640) 246,097 2,972
CASH AND CASH EQUIVALENTS—Beginning of period ....................... 339,048 92,951 89,979
CASH AND CASH EQUIVALENTS—End of period ........................... $270,408 $ 339,048 $ 92,951
SUPPLEMENTAL DISCLOSURES OF OTHER CASH FLOW INFORMATION:
Cash paid for income taxes .......................................... $ 2,828 $ 2,261 $ 4,006
SUPPLEMENTAL DISCLOSURES OF NONCASH INVESTING AND FINANCING
ACTIVITIES:
Conversion of preferred stock to common stock ............................. $ — $103,827 $ —
Purchases of property and equipment recorded in accounts payable and accrued liabilities . . $ 22,223 $ 10,974 $ 2,231
Deferred offering costs not yet paid ..................................... $ — $ 382 $ 1,318
Vesting of early exercised stock options ................................... $ 3,365 $ 3,704 $ 767
Issuance of Class A common stock for business combinations ..................... $ 71,478 $ 8,059 $ —
See notes to consolidated financial statements.
74