LinkedIn 2012 Annual Report Download - page 86
Download and view the complete annual report
Please find page 86 of the 2012 LinkedIn annual report below. You can navigate through the pages in the report by either clicking on the pages listed below, or by using the keyword search tool below to find specific information within the annual report.-
 1
1 -
2
-
3
-
4
-
5
-
6
-
7
-
8
-
9
-
10
-
11
-
12
-
13
-
14
-
15
-
16
-
17
-
18
-
19
-
20
-
21
-
22
-
23
-
24
-
25
-
26
-
27
-
28
-
29
-
30
-
31
-
32
-
33
-
34
-
35
-
36
-
37
-
38
-
39
-
40
-
41
-
42
-
43
-
44
-
45
-
46
-
47
-
48
-
49
-
50
-
51
-
52
-
53
-
54
-
55
-
56
-
57
-
58
-
59
-
60
-
61
-
62
-
63
-
64
-
65
-
66
-
67
-
68
-
69
-
70
-
71
-
72
-
73
-
74
-
75
-
 76
76 -
 77
77 -
 78
78 -
 79
79 -
 80
80 -
 81
81 -
 82
82 -
 83
83 -
 84
84 -
 85
85 -
 86
86 -
 87
87 -
 88
88 -
 89
89 -
 90
90 -
 91
91 -
 92
92 -
 93
93 -
 94
94 -
 95
95 -
 96
96 -
97
-
98
-
99
-
100
-
101
-
102
-
103
-
104
-
105
-
106
-
107
-
108
-
109
-
110
 |
 |

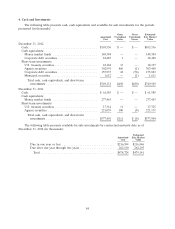
4. Cash and Investments
The following table presents cash, cash equivalents and available-for-sale investments for the periods
presented (in thousands):
Gross Gross Estimated
Amortized Unrealized Unrealized Fair Market
Cost Gains Losses Value
December 31, 2012:
Cash ....................................... $103,536 $ — $ — $103,536
Cash equivalents:
Money market funds ......................... 148,384 — — 148,384
Corporate debt securities ...................... 18,487 1 — 18,488
Short-term investments:
U.S. treasury securities ........................ 18,184 13 — 18,197
Agency securities ............................ 302,991 460 (1) 303,450
Corporate debt securities ...................... 155,937 24 (78) 155,883
Municipal securities .......................... 1,612 — (1) 1,611
Total cash, cash equivalents, and short-term
investments ............................. $749,131 $498 $(80) $749,549
December 31, 2011:
Cash ....................................... $ 61,585 $ — $ — $ 61,585
Cash equivalents:
Money market funds ......................... 277,463 — — 277,463
Short-term investments:
U.S. treasury securities ........................ 17,314 11 — 17,325
Agency securities ............................ 221,039 100 (8) 221,131
Total cash, cash equivalents, and short-term
investments ............................. $577,401 $111 $ (8) $577,504
The following table presents available-for-sale investments by contractual maturity date as of
December 31, 2012 (in thousands):
Estimated
Amortized Fair Market
Cost Value
Due in one year or less .............................. $216,594 $216,846
Due after one year through two years .................... 262,130 262,295
Total .......................................... $478,724 $479,141
84