LinkedIn 2012 Annual Report Download - page 43
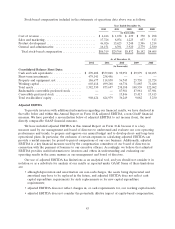
Download and view the complete annual report
Please find page 43 of the 2012 LinkedIn annual report below. You can navigate through the pages in the report by either clicking on the pages listed below, or by using the keyword search tool below to find specific information within the annual report.-
 1
1 -
2
-
3
-
4
-
5
-
6
-
7
-
8
-
9
-
10
-
11
-
12
-
13
-
14
-
15
-
16
-
17
-
18
-
19
-
20
-
21
-
22
-
23
-
24
-
25
-
26
-
27
-
28
-
29
-
30
-
31
-
32
-
 33
33 -
 34
34 -
 35
35 -
 36
36 -
 37
37 -
 38
38 -
 39
39 -
 40
40 -
 41
41 -
 42
42 -
 43
43 -
 44
44 -
 45
45 -
 46
46 -
 47
47 -
 48
48 -
 49
49 -
 50
50 -
 51
51 -
 52
52 -
 53
53 -
54
-
55
-
56
-
57
-
58
-
59
-
60
-
61
-
62
-
63
-
64
-
65
-
66
-
67
-
68
-
69
-
70
-
71
-
72
-
73
-
74
-
75
-
76
-
77
-
78
-
79
-
80
-
81
-
82
-
83
-
84
-
85
-
86
-
87
-
88
-
89
-
90
-
91
-
92
-
93
-
94
-
95
-
96
-
97
-
98
-
99
-
100
-
101
-
102
-
103
-
104
-
105
-
106
-
107
-
108
-
109
-
110
 |
 |
23APR201322175397
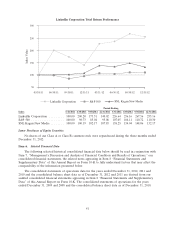
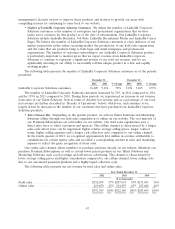
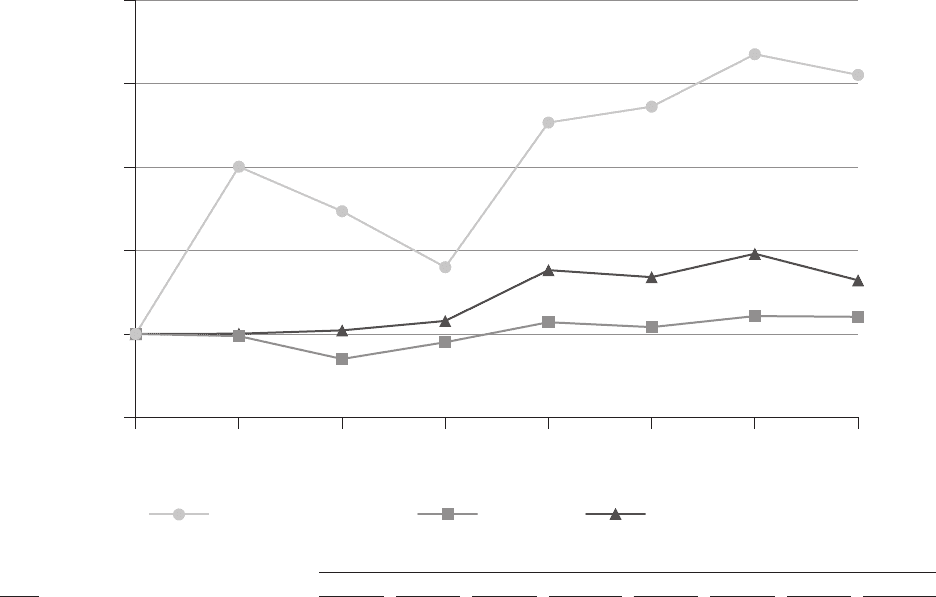
LinkedIn Corporation Total Return Performance
50
100
150
200
250
300
05/18/11 06/30/11 09/30/11 12/31/11 03/31/12 06/30/12 09/30/12 12/31/12
Index Value
S&P 500 SNL Kagan New Media
LinkedIn Corporation
Period Ending
Index 5/18/2011 6/30/2011 9/30/2011 12/31/2011 3/31/2012 6/30/2012 9/30/2012 12/31/2012
LinkedIn Corporation ......... 100.00 200.20 173.51 140.02 226.64 236.16 267.56 255.16
S&P 500 ................... 100.00 98.73 85.04 95.08 107.05 104.11 110.72 110.30
SNL Kagan New Media ........ 100.00 100.19 102.17 107.83 138.25 134.04 148.06 132.17
Issuer Purchases of Equity Securities
No shares of our Class A or Class B common stock were repurchased during the three months ended
December 31, 2012.
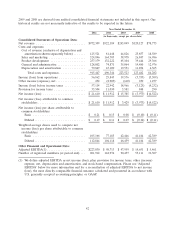
Item 6. Selected Financial Data
The following selected historical consolidated financial data below should be read in conjunction with
Item 7, ‘‘Management’s Discussion and Analysis of Financial Condition and Results of Operations,’’ our
consolidated financial statements, the related notes appearing in Item 8 ‘‘Financial Statements and
Supplementary Data’’ of this Annual Report on Form 10-K to fully understand factors that may affect the
comparability of the information presented below.
The consolidated statements of operations data for the years ended December 31, 2012, 2011 and
2010 and the consolidated balance sheet data as of December 31, 2012 and 2011 are derived from our
audited consolidated financial statements appearing in Item 8 ‘‘Financial Statements and Supplementary
Data’’ of this Annual Report on Form 10-K. The consolidated statements of operations for the years
ended December 31, 2009 and 2008 and the consolidated balance sheet data as of December 31, 2010,
41