LinkedIn 2012 Annual Report Download - page 63
Download and view the complete annual report
Please find page 63 of the 2012 LinkedIn annual report below. You can navigate through the pages in the report by either clicking on the pages listed below, or by using the keyword search tool below to find specific information within the annual report.-
 1
1 -
2
-
3
-
4
-
5
-
6
-
7
-
8
-
9
-
10
-
11
-
12
-
13
-
14
-
15
-
16
-
17
-
18
-
19
-
20
-
21
-
22
-
23
-
24
-
25
-
26
-
27
-
28
-
29
-
30
-
31
-
32
-
33
-
34
-
35
-
36
-
37
-
38
-
39
-
40
-
41
-
42
-
43
-
44
-
45
-
46
-
47
-
48
-
49
-
50
-
51
-
52
-
 53
53 -
 54
54 -
 55
55 -
 56
56 -
 57
57 -
 58
58 -
 59
59 -
 60
60 -
 61
61 -
 62
62 -
 63
63 -
 64
64 -
 65
65 -
 66
66 -
 67
67 -
 68
68 -
 69
69 -
 70
70 -
 71
71 -
 72
72 -
 73
73 -
74
-
75
-
76
-
77
-
78
-
79
-
80
-
81
-
82
-
83
-
84
-
85
-
86
-
87
-
88
-
89
-
90
-
91
-
92
-
93
-
94
-
95
-
96
-
97
-
98
-
99
-
100
-
101
-
102
-
103
-
104
-
105
-
106
-
107
-
108
-
109
-
110
 |
 |

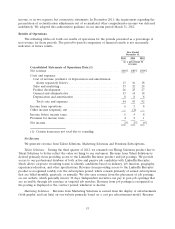
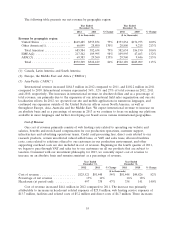
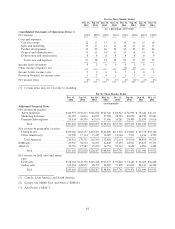
For the Three Months Ended
Dec 31, Sep 30, Jun 30, Mar 31, Dec 31, Sep 30, Jun 30, Mar 31,
2012 2012 2012 2012 2011 2011 2011 2011
(as a percentage of revenue)
Consolidated Statements of Operations Data:(1)
Net revenue ............................ 100% 100% 100% 100% 100% 100% 100% 100%
Costs and expenses:
Cost of revenue ........................ 12 13 13 13 14 16 15 18
Sales and marketing ..................... 33 33 33 35 32 33 30 31
Product development .................... 25 29 26 25 25 25 25 26
General and administrative ................ 13 13 14 13 15 14 14 14
Depreciation and amortization .............. 8 9 8 8 8 8 8 9
Total costs and expenses ................. 91 98 94 94 94 97 92 99
Income from operations .................... 9 2 6 6 6 3 8 1
Other income (expense), net ................. — — — — (1) (1) — —
Income before income taxes ................. 9 3 6 6 5 2 8 2
Provision (benefit) for income taxes ............ 5 2 4 3 1 3 4 —
Net income (loss) ........................ 4% 1% 1% 3% 4% (1)% 4% 2%
(1) Certain items may not total due to rounding.
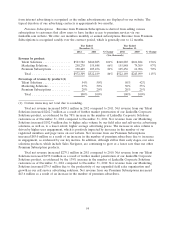
For the Three Months Ended
Dec 31, Sep 30, Jun 30, Mar 31, Dec 31, Sep 30, Jun 30, Mar 31,
2012 2012 2012 2012 2011 2011 2011 2011
(in thousands)
Additional Financial Data:
Net revenue by product:
Talent Solutions .............. $160,997 $138,433 $121,592 $102,560 $ 84,937 $ 70,995 $ 58,620 $46,333
Marketing Solutions ........... 83,187 64,036 63,105 47,950 49,523 40,072 38,570 27,683
Premium Subscriptions ......... 59,434 49,559 43,510 37,946 33,281 28,409 23,850 19,916
Total ................... $303,618 $252,028 $228,207 $188,456 $167,741 $139,476 $121,040 $93,932
Net revenue by geographic location:
United States ................ $189,006 $162,377 $147,253 $120,849 $111,970 $ 94,005 $ 82,739 $65,120
Other Americas(1) ............ 21,909 17,134 15,047 12,009 10,144 7,911 6,146 4,599
Total Americas ............. 210,915 179,511 162,300 132,858 122,114 101,916 88,885 69,719
EMEA(2) .................... 69,910 54,530 50,057 42,845 35,494 28,911 25,859 19,731
APAC(3) .................... 22,793 17,987 15,850 12,753 10,133 8,649 6,296 4,482
Total ................... $303,618 $252,028 $228,207 $188,456 $167,741 $139,476 $121,040 $93,932
Net revenue by field sales and online
sales:
Field sales .................. $178,364 $143,176 $129,448 $101,471 $ 95,842 $ 74,465 $ 66,699 $50,628
Online sales ................. 125,254 108,852 98,759 86,985 71,899 65,011 54,341 43,304
Total ................... $303,618 $252,028 $228,207 $188,456 $167,741 $139,476 $121,040 $93,932
(1) Canada, Latin America and South America
(2) Europe, the Middle East and Africa (‘‘EMEA’’)
(3) Asia-Pacific (‘‘APAC’’)
61