LinkedIn 2012 Annual Report Download - page 62
Download and view the complete annual report
Please find page 62 of the 2012 LinkedIn annual report below. You can navigate through the pages in the report by either clicking on the pages listed below, or by using the keyword search tool below to find specific information within the annual report.-
 1
1 -
2
-
3
-
4
-
5
-
6
-
7
-
8
-
9
-
10
-
11
-
12
-
13
-
14
-
15
-
16
-
17
-
18
-
19
-
20
-
21
-
22
-
23
-
24
-
25
-
26
-
27
-
28
-
29
-
30
-
31
-
32
-
33
-
34
-
35
-
36
-
37
-
38
-
39
-
40
-
41
-
42
-
43
-
44
-
45
-
46
-
47
-
48
-
49
-
50
-
51
-
 52
52 -
 53
53 -
 54
54 -
 55
55 -
 56
56 -
 57
57 -
 58
58 -
 59
59 -
 60
60 -
 61
61 -
 62
62 -
 63
63 -
 64
64 -
 65
65 -
 66
66 -
 67
67 -
 68
68 -
 69
69 -
 70
70 -
 71
71 -
 72
72 -
73
-
74
-
75
-
76
-
77
-
78
-
79
-
80
-
81
-
82
-
83
-
84
-
85
-
86
-
87
-
88
-
89
-
90
-
91
-
92
-
93
-
94
-
95
-
96
-
97
-
98
-
99
-
100
-
101
-
102
-
103
-
104
-
105
-
106
-
107
-
108
-
109
-
110
 |
 |

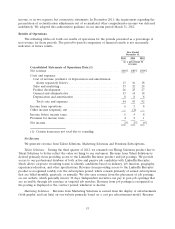
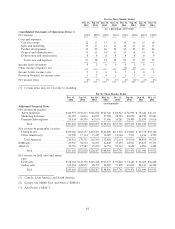
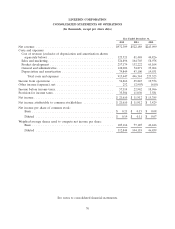
Annual Report on Form 10-K. The results of historical periods are not necessarily indicative of the results
of operations for a full year or any future period.
For the Three Months Ended
Dec 31, Sep 30, Jun 30, Mar 31, Dec 31, Sep 30, Jun 30, Mar 31,
2012 2012 2012 2012 2011 2011 2011 2011
(in thousands, except per share data)
Consolidated Statements of
Operations Data:(1)
Net revenue .................. $303,618 $252,028 $228,207 $188,456 $167,741 $139,476 $121,040 $93,932
Costs and expenses:
Cost of revenue (exclusive of
depreciation and amortization shown
separately below)(2) ........... 36,243 33,778 30,367 25,133 24,166 22,096 18,403 16,783
Sales and marketing(2) ........... 100,104 83,168 75,740 65,884 53,249 46,074 36,019 29,361
Product development(2) .......... 77,276 72,730 60,080 47,093 42,051 35,022 30,414 24,735
General and administrative(2) ...... 38,980 33,194 30,974 24,854 24,463 20,121 16,673 13,614
Depreciation and amortization .... 24,297 23,122 17,548 14,882 13,784 11,555 9,602 8,159
Total costs and expenses ....... 276,900 245,992 214,709 177,846 157,713 134,868 111,111 92,652
Income from operations .......... 26,718 6,036 13,498 10,610 10,028 4,608 9,929 1,280
Other income (expense), net ....... 24 672 (668) 224 (1,575) (1,788) 11 449
Income before income taxes ....... 26,742 6,708 12,830 10,834 8,453 2,820 9,940 1,729
Provision (benefit) for income taxes . . 15,234 4,406 10,019 5,845 1,534 4,418 5,427 (349)
Net income (loss) ............... $ 11,508 $ 2,302 $ 2,811 $ 4,989 $ 6,919 $ (1,598) $ 4,513 $ 2,078
Net income (loss) attributable to
common stockholders .......... $11,508 $ 2,302 $ 2,811 $ 4,989 $ 6,919 $ (1,598) $ 4,513 $ —
Net income (loss) per share
attributable to common
stockholders:
Basic .................... $ 0.11 $ 0.02 $ 0.03 $ 0.05 $ 0.07 $ (0.02) $ 0.07 $ —
Diluted .................. $ 0.10 $ 0.02 $ 0.03 $ 0.04 $ 0.06 $ (0.02) $ 0.04 $ —
Weighted-average shares used to
compute net income (loss) per share
attributable to common
stockholders:
Basic .................... 107,924 106,304 104,185 102,210 98,531 96,276 69,395 43,726
Diluted .................. 114,095 113,618 112,317 111,310 108,612 96,276 103,129 51,459
(1) In the fourth quarter of 2012, we recognized approximately $4.4 million in revenue attributable to commissions
for certain agency sales and recorded a corresponding amount in sales and marketing expense to reflect the gross
recognition of these sales.
(2) Stock-based compensation included in above line items:
Cost of revenue ................. $2,197 $ 2,182 $ 1,236 $ 801 $ 714 $ 469 $ 312 $ 183
Sales and marketing .............. 5,333 5,198 4,327 2,868 2,294 2,577 2,105 1,098
Product development .............. 14,956 14,609 10,572 5,889 5,423 3,711 2,888 1,603
General and administrative .......... 5,086 4,809 3,188 3,068 2,181 1,741 1,510 959
Total stock-based compensation ..... $27,572 $26,798 $19,323 $12,626 $10,612 $8,498 $6,815 $3,843
60