Lexmark 2014 Annual Report Download - page 96
Download and view the complete annual report
Please find page 96 of the 2014 Lexmark annual report below. You can navigate through the pages in the report by either clicking on the pages listed below, or by using the keyword search tool below to find specific information within the annual report.-
 1
1 -
2
-
3
-
4
-
5
-
6
-
7
-
8
-
9
-
10
-
11
-
12
-
13
-
14
-
15
-
16
-
17
-
18
-
19
-
20
-
21
-
22
-
23
-
24
-
25
-
26
-
27
-
28
-
29
-
30
-
31
-
32
-
33
-
34
-
35
-
36
-
37
-
38
-
39
-
40
-
41
-
42
-
43
-
44
-
45
-
46
-
47
-
48
-
49
-
50
-
51
-
52
-
53
-
54
-
55
-
56
-
57
-
58
-
59
-
60
-
61
-
62
-
63
-
64
-
65
-
66
-
67
-
68
-
69
-
70
-
71
-
72
-
73
-
74
-
75
-
76
-
77
-
78
-
79
-
80
-
81
-
82
-
83
-
84
-
85
-
 86
86 -
 87
87 -
 88
88 -
 89
89 -
 90
90 -
 91
91 -
 92
92 -
 93
93 -
 94
94 -
 95
95 -
 96
96 -
 97
97 -
 98
98 -
 99
99 -
 100
100 -
 101
101 -
 102
102 -
 103
103 -
 104
104 -
 105
105 -
 106
106 -
107
-
108
-
109
-
110
-
111
-
112
-
113
-
114
-
115
-
116
-
117
-
118
-
119
-
120
-
121
-
122
-
123
-
124
-
125
-
126
-
127
-
128
-
129
-
130
-
131
-
132
-
133
-
134
-
135
-
136
-
137
-
138
-
139
-
140
 |
 |

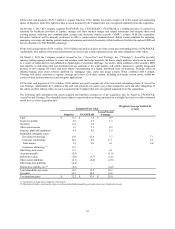
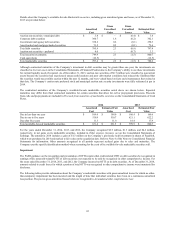
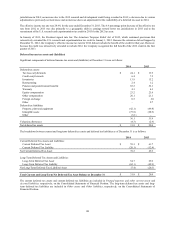
Details about the Company’s available-for-sale Marketable securities, including gross unrealized gains and losses, as of December 31,
2013 are provided below:
Gross Gross
Amortized Unrealized Unrealized Estimated Fair
Cost Gains Losses Value
Auction rate securities - municipal debt $ 3.8 $ – $ (0.4) $ 3.4
Corporate debt securities 360.7 1.6 (0.2) 362.1
Government and agency debt securities 358.2 0.2 (0.1) 358.3
Asset-backed and mortgage-backed securities 73.2 0.5 (0.1) 73.6
Total debt securities 795.9 2.3 (0.8) 797.4
Auction rate securities - preferred 4.0 – (0.7) 3.3
Total security investments 799.9 2.3 (1.5) 800.7
Cash equivalents (12.5) – – (12.5)
Total marketable securities $ 787.4 $ 2.3 $ (1.5) $ 788.2
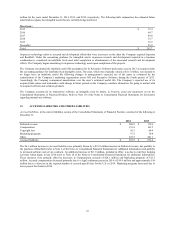
Although contractual maturities of the Company’s investment in debt securities may be greater than one year, the investments are
classified as Current assets in the Consolidated Statements of Financial Position due to the Company’s ability to use these investments
for current liquidity needs if required. As of December 31, 2013, auction rate securities of $6.7 million were classified as noncurrent
assets because the securities had experienced unsuccessful auctions and poor debt market conditions had reduced the likelihood that
the securities would successfully auction within the next 12 months, and were valued based on facts and circumstances that existed at
that date. The Company’s auction rate preferred stock and municipal auction rate security investments were fully redeemed at par in
2014.
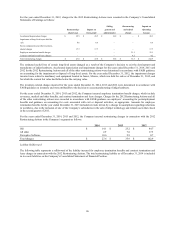
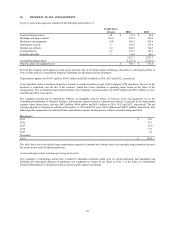
The contractual maturities of the Company’s available-for-sale marketable securities noted above are shown below. Expected
maturities may differ from final contractual maturities for certain securities that allow for call or prepayment provisions. Proceeds
from calls and prepayments are included in Proceeds from maturities of marketable securities on the Consolidated Statements of Cash
Flows.
2014 2013
Amortized Estimated Fair Amortized Estimated Fair
Cost Value Cost Value
Due in less than one year $ 109.0 $ 109.0 $ 160.4 $ 160.6
Due in one to five years 510.9 510.7 621.1 622.2
Due after five years 11.5 11.8 18.4 17.9
Total available-for-sale marketable securities $ 631.4 $ 631.5 $ 799.9 $ 800.7
For the years ended December 31, 2014, 2013, and 2012, the Company recognized $2.9 million, $1.3 million, and $4.2 million,
respectively, in net gains on its marketable securities, included in Other expense (income), net on the Consolidated Statements of
Earnings. The amount in 2014 includes a gain of $1.3 million on the Company’s previously held investment in shares of ReadSoft,
which were purchased in 2014 and marked to fair value on the acquisition date. Refer to Note 4 of the Notes to Consolidated Financial
Statements for information. Other amounts recognized in all periods represent realized gains due to sales and maturities. The
Company uses the specific identification method when accounting for the costs of its available-for-sale marketable securities sold.
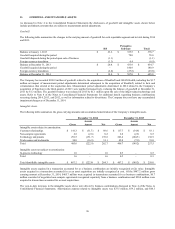
Impairment
The FASB guidance on the recognition and presentation of OTTI requires that credit-related OTTI on debt securities be recognized in
earnings while noncredit-related OTTI of debt securities not expected to be sold be recognized in other comprehensive income. For
the years ended December 31, 2014, 2013, and 2012, the Company incurred no OTTI on its debt securities. As of December 31, 2014,
amounts related to credit losses for which a portion of total OTTI was recognized in other comprehensive income were immaterial for
disclosure.
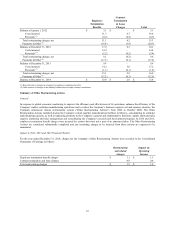
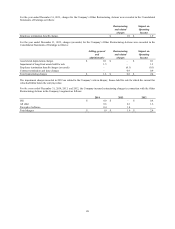
The following tables provide information about the Company’s marketable securities with gross unrealized losses for which no other-
than-temporary impairment has been incurred and the length of time that individual securities have been in a continuous unrealized
loss position. The pre-tax gross unrealized losses below are recognized in Accumulated other comprehensive loss:
92