Lexmark 2014 Annual Report Download - page 109
Download and view the complete annual report
Please find page 109 of the 2014 Lexmark annual report below. You can navigate through the pages in the report by either clicking on the pages listed below, or by using the keyword search tool below to find specific information within the annual report.-
 1
1 -
2
-
3
-
4
-
5
-
6
-
7
-
8
-
9
-
10
-
11
-
12
-
13
-
14
-
15
-
16
-
17
-
18
-
19
-
20
-
21
-
22
-
23
-
24
-
25
-
26
-
27
-
28
-
29
-
30
-
31
-
32
-
33
-
34
-
35
-
36
-
37
-
38
-
39
-
40
-
41
-
42
-
43
-
44
-
45
-
46
-
47
-
48
-
49
-
50
-
51
-
52
-
53
-
54
-
55
-
56
-
57
-
58
-
59
-
60
-
61
-
62
-
63
-
64
-
65
-
66
-
67
-
68
-
69
-
70
-
71
-
72
-
73
-
74
-
75
-
76
-
77
-
78
-
79
-
80
-
81
-
82
-
83
-
84
-
85
-
86
-
87
-
88
-
89
-
90
-
91
-
92
-
93
-
94
-
95
-
96
-
97
-
98
-
 99
99 -
 100
100 -
 101
101 -
 102
102 -
 103
103 -
 104
104 -
 105
105 -
 106
106 -
 107
107 -
 108
108 -
 109
109 -
 110
110 -
 111
111 -
 112
112 -
 113
113 -
 114
114 -
 115
115 -
 116
116 -
 117
117 -
 118
118 -
 119
119 -
120
-
121
-
122
-
123
-
124
-
125
-
126
-
127
-
128
-
129
-
130
-
131
-
132
-
133
-
134
-
135
-
136
-
137
-
138
-
139
-
140
 |
 |

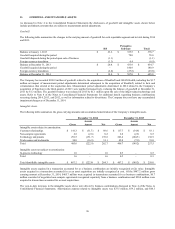
Year Ended December 31, 2012
Change, Tax benefit Change,
net of tax (liability) pre-tax
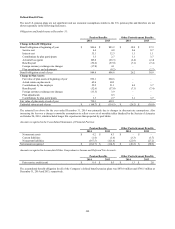
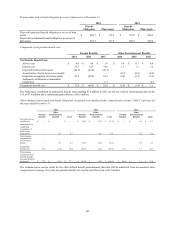
Components of other comprehensive earnings (loss):
Foreign currency translation adjustment $ 14.7 $ (0.6) $ 15.3
Recognition of pension and other postretirement benefit plans prior service
credit 0.2 0.1 0.1
Net unrealized (loss) gain on OTTI marketable securities (0.6) 0.4 (1.0)
Net unrealized gain (loss) on marketable securities 2.6 (0.6) 3.2
Forward starting interest rate swap designated as a cash flow hedge (0.9) 0.5 (1.4)
Total other comprehensive earnings (loss) $ 16.0 $ (0.2) $ 16.2
The change in Accumulated other comprehensive (loss) earnings, net of tax, consists of the following:
Recognition of Net Forward-Starting
Pension and Unrealized Net Interest Rate Accumulated
Foreign Other Gain (Loss) on Unrealized Unrealized Swap Other
Currency Postretirement Marketable Gain (Loss) on Gain on Designated as a Comprehensive
Translation Benefit Plans Securities – Marketable Cash Flow Cash Flow (Loss)
Adjustment Prior Service Credit OTTI Securities Hedges Hedge Earnings
Balance at December 31,
2011 $ (20.3) $ (0.9) $ 0.7 $ (0.6) – $ – $ (21.1)
Net 2012 other
comprehensive (loss)
earnings 14.7 0.2 (0.6) 2.6 – (0.9) 16.0
Balance at December 31,
2012 (5.6) (0.7) 0.1 2.0 – (0.9) (5.1)
Other comprehensive
income before
reclassifications (21.3) 2.1 0.1 (0.1) – 0.9 (18.3)
Amounts reclassified
from accumulated
other comprehensive
income (10.7) – (0.1) (1.0) – – (11.8)
Net 2013 other
comprehensive earnings
(loss) (32.0) 2.1 – (1.1) – 0.9 (30.1)
Balance at December 31,
2013 (37.6) 1.4 0.1 0.9 – – (35.2)
Other comprehensive
income before
reclassifications (71.2) 0.2 0.1 1.7 15.9 – (53.3)
Amounts reclassified
from accumulated
other comprehensive
income – (0.4) (0.2) (2.5) – – (3.1)
Net 2014 other
comprehensive (loss)
earnings (71.2) (0.2) (0.1) (0.8) 15.9 – (56.4)
Balance at December 31,
2014 $ (108.8) $ 1.2 $ – $ 0.1 15.9 $ – $ (91.6)
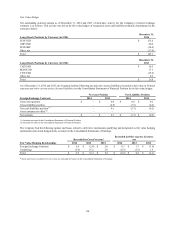
Changes in the Company's foreign currency translation adjustments were due to a number of factors as the Company operates in
various currencies throughout the world. The primary drivers of the unfavorable change in 2014 were decreases in the exchange rate
values of approximately 11% in the Brazilian real, 12% in the Mexican peso, 12% in the Euro and 18% in the Swedish krona. The
primary drivers of the unfavorable change in 2013 were decreases in the exchange rate values of approximately 8% in the Philippine
peso, 13% in the Brazilian real and 19% in the South African rand. The primary drivers of the favorable change in 2012 were
increases in the exchange rate values of approximately 7% in the Philippine peso, 8% in the Mexican peso and 2% in the Euro. The
exchange rates referenced above are calculated as U.S. dollar per unit of foreign currency.
105