Lexmark 2014 Annual Report Download - page 57
Download and view the complete annual report
Please find page 57 of the 2014 Lexmark annual report below. You can navigate through the pages in the report by either clicking on the pages listed below, or by using the keyword search tool below to find specific information within the annual report.-
 1
1 -
2
-
3
-
4
-
5
-
6
-
7
-
8
-
9
-
10
-
11
-
12
-
13
-
14
-
15
-
16
-
17
-
18
-
19
-
20
-
21
-
22
-
23
-
24
-
25
-
26
-
27
-
28
-
29
-
30
-
31
-
32
-
33
-
34
-
35
-
36
-
37
-
38
-
39
-
40
-
41
-
42
-
43
-
44
-
45
-
46
-
 47
47 -
 48
48 -
 49
49 -
 50
50 -
 51
51 -
 52
52 -
 53
53 -
 54
54 -
 55
55 -
 56
56 -
 57
57 -
 58
58 -
 59
59 -
 60
60 -
 61
61 -
 62
62 -
 63
63 -
 64
64 -
 65
65 -
 66
66 -
 67
67 -
68
-
69
-
70
-
71
-
72
-
73
-
74
-
75
-
76
-
77
-
78
-
79
-
80
-
81
-
82
-
83
-
84
-
85
-
86
-
87
-
88
-
89
-
90
-
91
-
92
-
93
-
94
-
95
-
96
-
97
-
98
-
99
-
100
-
101
-
102
-
103
-
104
-
105
-
106
-
107
-
108
-
109
-
110
-
111
-
112
-
113
-
114
-
115
-
116
-
117
-
118
-
119
-
120
-
121
-
122
-
123
-
124
-
125
-
126
-
127
-
128
-
129
-
130
-
131
-
132
-
133
-
134
-
135
-
136
-
137
-
138
-
139
-
140
 |
 |
Claron’s solutions help healthcare delivery organizations provide universal access to patient imaging studies and other content across
and between healthcare enterprises.
Refer to Part II, Item 8, Note 4 of the Notes to Consolidated Financial Statements for additional information regarding business
combinations.
Marketable securities
The Company decreased its marketable securities investments in 2014 by $162.7 million, primarily for business acquisition activity
listed above. The Company increased its marketable securities investments in 2013 by $94.0 million primarily with proceeds from the
debt issuance and the sale of inkjet-related technology and assets.
The Company’s investments in marketable securities are classified and accounted for as available-for-sale and reported at fair value.
At December 31, 2014 and December 31, 2013, the Company’s marketable securities portfolio consisted of asset-backed and
mortgage-backed securities, corporate debt securities, U.S. government and agency debt securities, international government
securities, commercial paper and certificates of deposit. The Company’s auction rate securities, with a value of $6.7 million at
December 31, 2013, were reported in the noncurrent assets section of the Company’s Consolidated Statements of Financial Position.
In 2014 all of the auction rate securities were called, at par, and the Company had no such investments remaining at December 31,
2014.
The marketable securities portfolio held by the Company contains market risk (including interest rate risk) and credit risk. These risks
are managed through the Company’s investment policy and investment management contracts with professional asset managers which
require sector diversification, limitations on maturity and duration, minimum credit quality and other criteria. The Company also
maintains adequate issuer diversification through strict issuer limits except for securities issued by the U.S. government or its
agencies. The Company’s ability to access the portfolio to fund operations could be limited by the liquidity in the market as well as
possible tax implications of moving proceeds across jurisdictions.
The Company assesses its marketable securities for other-than-temporary declines in value in accordance with the model provided
under the FASB’s amended guidance. The Company released the remaining OTTI related to the auction rate securities in 2014 due to
their call referenced above.
Level 3 fair value measurements are based on inputs that are unobservable and significant to the overall valuation. Level 3
measurements were 0.2% of the Company’s total available-for-sale marketable securities portfolio at December 31, 2014 compared to
1.1% at December 31, 2013.
Refer to Part II, Item 8, Note 3 of the Notes to Consolidated Financial Statements for additional information regarding fair value
measurements. Refer to Part II, Item 8, Note 7 of the Notes to Consolidated Financial Statements for additional information regarding
marketable securities.
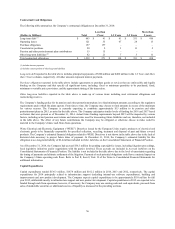
Capital expenditures
The Company invested $136.3 million, $167.4 million, and $162.2 million into Property, plant and equipment for the years 2014,
2013 and 2012, respectively. Further discussion regarding 2014 capital expenditures as well as anticipated spending for 2015 are
provided near the end of Item 7.
Financing activities
The fluctuations in the net cash flows used for financing activities were principally due to the Company’s purchases of ReadSoft
shares after gaining control and net proceeds from the issuance of senior notes. In 2014, cash flows used for financing activities were
$323.7 million, due mainly to purchases of shares from non-controlling interest in ReadSoft of $154.9 million, share repurchases of
$80.0 million and dividend payments of $85.3 million. In 2013, cash flows used for financing activities were $107.7 million, due
mainly to net proceeds from debt activities of $47.3 million, share repurchases of $82.0 million and dividend payments of $75.3
million. In 2012, cash flows used for financing activities were $263.4 million, due mainly to share repurchases of $190.0 million and
dividend payments of $78.6 million, less proceeds from employee stock plans of $5.8 million.
Intra-period financing activities
The Company used its trade receivables facility, bank overdrafts and other financing sources to supplement daily cash needs of the
Company and its subsidiaries in 2014. In 2014, the total of such borrowings in the U.S. reached a maximum amount of $126 million to
fund certain capital, financing and operational requirements. The average borrowings outstanding during 2014 were $13.6 million.
53