Lexmark 2014 Annual Report Download - page 2
Download and view the complete annual report
Please find page 2 of the 2014 Lexmark annual report below. You can navigate through the pages in the report by either clicking on the pages listed below, or by using the keyword search tool below to find specific information within the annual report.-
 1
1 -
 2
2 -
 3
3 -
 4
4 -
 5
5 -
 6
6 -
 7
7 -
 8
8 -
 9
9 -
 10
10 -
 11
11 -
 12
12 -
 13
13 -
14
-
15
-
16
-
17
-
18
-
19
-
20
-
21
-
22
-
23
-
24
-
25
-
26
-
27
-
28
-
29
-
30
-
31
-
32
-
33
-
34
-
35
-
36
-
37
-
38
-
39
-
40
-
41
-
42
-
43
-
44
-
45
-
46
-
47
-
48
-
49
-
50
-
51
-
52
-
53
-
54
-
55
-
56
-
57
-
58
-
59
-
60
-
61
-
62
-
63
-
64
-
65
-
66
-
67
-
68
-
69
-
70
-
71
-
72
-
73
-
74
-
75
-
76
-
77
-
78
-
79
-
80
-
81
-
82
-
83
-
84
-
85
-
86
-
87
-
88
-
89
-
90
-
91
-
92
-
93
-
94
-
95
-
96
-
97
-
98
-
99
-
100
-
101
-
102
-
103
-
104
-
105
-
106
-
107
-
108
-
109
-
110
-
111
-
112
-
113
-
114
-
115
-
116
-
117
-
118
-
119
-
120
-
121
-
122
-
123
-
124
-
125
-
126
-
127
-
128
-
129
-
130
-
131
-
132
-
133
-
134
-
135
-
136
-
137
-
138
-
139
-
140
 |
 |

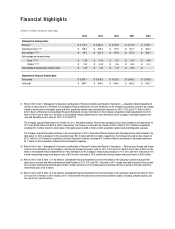
Financial Highlights
(1) Refer to Part II, Item 7, Management’s Discussion and Analysis of Financial Condition and Results of Operations — Acquisition-Related Adjustments
and Part II, Item 8, Note 4 of the Notes to Consolidated Financial Statements for more information on the Company’s acquisitions and pre-tax charges
related to amortization of intangible assets and other acquisition-related costs and integration expenses for 2014, 2013 and 2012. Refer to Part II,
Item 8, Note 4 of the Notes to Consolidated Financial Statements for more information on the Company’s divestiture-related adjustments for 2013.
Refer to Part II, Item 8, Note 20 of the Notes to Consolidated Financial Statements for more information on the Company’s reportable segment Rev-
enue and Operating income (loss) for 2014, 2013 and 2012.
The Company acquired Pallas Athena on October 18, 2011. Perceptive Software Revenue and Operating income (loss) included in the table above for
2011 were $94.8 million and $(29.5) million, respectively. The Company incurred pre-tax charges of $24.5 million in 2011 related to acquisitions,
including $21.2 million related to amortization of intangible assets and $3.3 million of other acquisition-related costs and integration expenses.
The Company acquired Perceptive Software in the second quarter of 2010. Perceptive Software Revenue and Operating income (loss) included in the
table above for 2010 (subsequent to the acquisition) were $37.3 million and $(16.0) million, respectively. The Company incurred pre-tax charges of
$19.1 million in 2010 related to acquisitions, primarily Perceptive Software, including $12.0 million related to amortization of intangible assets and
$7.1 million of other acquisition-related costs and integration expenses.
(2) Refer to Part II, Item 7, Management’s Discussion and Analysis of Financial Condition and Results of Operations — Restructuring Charges and Project
Costs for more information on the Company’s restructuring charges and project costs for 2014, 2013 and 2012. Refer to Part II, Item 8, Note 5 of the
Notes to Consolidated Financial Statements for more information on the Company’s restructuring charges for 2014, 2013 and 2012. Amounts in 2011
include restructuring charges and project costs of $29.9 million. Amounts in 2010 include restructuring charges and project costs of $38.6 million.
(3) Refer to Part II, Item 8, Note 17 of the Notes to Consolidated Financial Statements for more information on the Company’s asset and actuarial net
(gain) loss on pension and other postretirement benefit plans for 2014, 2013 and 2012. Amounts in 2011 include asset and actuarial net loss on pen-
sion and other postretirement benefit plans of $94.7 million. Amounts in 2010 include asset and actuarial net loss on pension and other postretire-
ment benefit plans of $1.9 million.
(4) Refer to Part II, Item 8, Note 14 of the Notes to Consolidated Financial Statements for more information on the Company’s discrete tax items for 2014,
2013 and 2012. Amounts in 2010 include a $14.7 million benefit from discrete tax items mainly related to audits concluding, statutes expiring, and
true-ups of prior year tax returns.
2014 2013 2012 2011 2010
Statement of Earnings Data:
Revenue (1) $ 3,710.5 $ 3,667.6 $ 3,797.6 $ 4,173.0 $ 4,199.7
Operating income (1)(2)(3) $ 149.2 $ 409.2 $ 191.5 $ 367.7 $ 460.2
Net earnings (1)(2)(3)(4) $ 79.1 $ 261.8 $ 107.6 $ 275.2 $ 350.2
Net earnings per common share
Basic (1)(2)(3)(4) $ 1.28 $ 4.16 $ 1.57 $ 3.57 $ 4.46
Diluted (1)(2)(3)(4) $ 1.25 $ 4.08 $ 1.55 $ 3.53 $ 4.41
Cash dividends declared per common share $ 1.38 $ 1.20 $ 1.15 $ 0.25 $ –
Statement of Financial Position Data:
Total assets $ 3,633.1 $ 3,619.5 $ 3,525.3 $ 3,640.2 $ 3,706.8
Total debt $ 699.7 $ 699.6 $ 649.6 $ 649.3 $ 649.1
(Dollars in millions, except per share data)