Lexmark 2014 Annual Report Download - page 42
Download and view the complete annual report
Please find page 42 of the 2014 Lexmark annual report below. You can navigate through the pages in the report by either clicking on the pages listed below, or by using the keyword search tool below to find specific information within the annual report.-
 1
1 -
2
-
3
-
4
-
5
-
6
-
7
-
8
-
9
-
10
-
11
-
12
-
13
-
14
-
15
-
16
-
17
-
18
-
19
-
20
-
21
-
22
-
23
-
24
-
25
-
26
-
27
-
28
-
29
-
30
-
31
-
 32
32 -
 33
33 -
 34
34 -
 35
35 -
 36
36 -
 37
37 -
 38
38 -
 39
39 -
 40
40 -
 41
41 -
 42
42 -
 43
43 -
 44
44 -
 45
45 -
 46
46 -
 47
47 -
 48
48 -
 49
49 -
 50
50 -
 51
51 -
 52
52 -
53
-
54
-
55
-
56
-
57
-
58
-
59
-
60
-
61
-
62
-
63
-
64
-
65
-
66
-
67
-
68
-
69
-
70
-
71
-
72
-
73
-
74
-
75
-
76
-
77
-
78
-
79
-
80
-
81
-
82
-
83
-
84
-
85
-
86
-
87
-
88
-
89
-
90
-
91
-
92
-
93
-
94
-
95
-
96
-
97
-
98
-
99
-
100
-
101
-
102
-
103
-
104
-
105
-
106
-
107
-
108
-
109
-
110
-
111
-
112
-
113
-
114
-
115
-
116
-
117
-
118
-
119
-
120
-
121
-
122
-
123
-
124
-
125
-
126
-
127
-
128
-
129
-
130
-
131
-
132
-
133
-
134
-
135
-
136
-
137
-
138
-
139
-
140
 |
 |

recognized based upon the excess of the carrying value of the assets over the fair value of the assets. The determination of the asset
group to be tested for recoverability is based on company-specific operating characteristics, including shared cost structures and
interdependency of revenues between assets. An impairment review incorporates estimates of forecasted revenue and costs that may
be associated with an asset as well as the expected periods that the asset (or asset group) may be utilized. Fair value is determined
based on the highest and best use of the assets considered from the perspective of market participants, which may be different than the
Company’s actual intended use of the asset (or asset group).
Lexmark also reviews any legal and contractual obligations associated with the retirement of its long-lived assets and records assets
and liabilities, as necessary, related to such obligations. The asset recorded is amortized over the useful life of the related long-lived
tangible asset. The liability recorded is relieved when the costs are incurred to retire the related long-lived tangible asset. Each
obligation is estimated based on current law and technology; accordingly, such estimates could change as the Company periodically
evaluates and revises such estimates based on expenditures against established reserves and the availability of additional information.
The Company’s asset retirement obligations are currently not material to the Company’s Consolidated Statements of Financial
Position.
RESULTS OF OPERATIONS
Operating Results Summary
The following discussion and analysis should be read in conjunction with the Consolidated Financial Statements and Notes thereto.
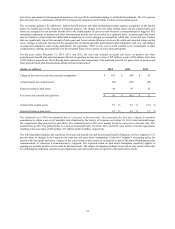
The following table summarizes the results of the Company’s operations for the years ended December 31, 2014, 2013 and 2012:
2014 2013 2012
(Dollars in millions) Dollars % of Rev Dollars % of Rev Dollars % of Rev
Revenue $ 3,710.5 100 % $ 3,667.6 100 % $ 3,797.6 100 %
Gross profit 1,409.8 38 % 1,443.9 39 % 1,401.8 37 %
Operating expense 1,260.6 34 % 1,034.7 28 % 1,210.3 32 %
Operating income 149.2 4 % 409.2 11 % 191.5 5 %
Net earnings 79.1 2 % 261.8 7 % 107.6 3 %
During 2014, consolidated revenue increased 1% compared to prior year. Gross profit decreased 2%, Operating expense increased
22% and Operating income decreased 64% when compared to the same period in 2013.
Net earnings for the year ended December 31, 2014 declined 70% from the prior year primarily due to lower operating income.
Operating income for the year ended December 31, 2014 included $119.1 million of pre-tax acquisition-related adjustments, a pension
and other postretirement benefit plan asset and actuarial net loss of $80.5 million, $45.8 million of pre-tax restructuring charges and
project costs and $1.7 million of pre-tax divestiture-related cost. The Company uses the term “project costs” for incremental charges
related to the execution of its restructuring plans. The Company uses the term “acquisition-related adjustments” for purchase
accounting adjustments and incremental acquisition and integration costs related to acquisitions.
During 2013, consolidated revenue declined 3% compared to 2012. Gross profit increased 3%, Operating expense decreased 15% and
Operating income increased 114% when compared to the same period in 2012.
Net earnings for the year ended December 31, 2013 increased 143% from the prior year primarily due to higher operating income.
Operating income in 2013 included a pension and other postretirement benefit plan asset and actuarial net gain of $83.0 million, $69.2
million of pre-tax divestiture-related benefit, $90.4 million of pre-tax acquisition-related adjustments and $54.5 million of pre-tax
restructuring charges and project costs.
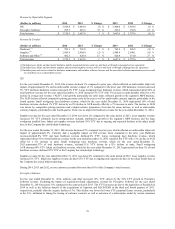
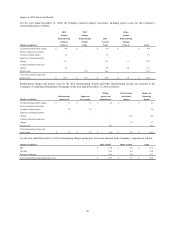
Revenue
For the year ended December 31, 2014, consolidated revenue increased 1% YTY, reflecting higher laser revenue in the ISS segment
and increased Perceptive Software revenue, offset by an unfavorable impact of approximately 4% due to the Company’s exit of inkjet
technology and an unfavorable YTY currency impact of 1%.
38