Lexmark 2014 Annual Report Download - page 125
Download and view the complete annual report
Please find page 125 of the 2014 Lexmark annual report below. You can navigate through the pages in the report by either clicking on the pages listed below, or by using the keyword search tool below to find specific information within the annual report.
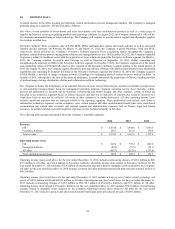
Subsequent to the date of the financial statements, the Company entered into and settled an ASR Agreement with a financial
institution counterparty, resulting in a total of approximately 0.7 million shares repurchased at a cost of $30 million. Upon delivery of
these shares, the number of shares held in treasury increased from approximately 35.7 million shares to approximately 36.4 million
shares. The payment of $30 million by the Company to the financial institution counterparty for the repurchase of shares was funded
from available U.S. cash equivalents and current marketable securities.
22. QUARTERLY FINANCIAL DATA (UNAUDITED)
First Second Third Fourth
Quarter Quarter Quarter Quarter
2014:
Revenue $ 877.7 $ 891.8 $ 918.1 $ 1,022.9
Gross profit (1) 341.6 351.2 357.3 359.7
Operating income (loss) (1) 53.9 62.4 54.5 (21.6)
Net earnings (loss) (1) 29.3 37.5 37.9 (25.6)
Basic EPS* (1) $ 0.47 $ 0.60 $ 0.61 $ (0.42)
Diluted EPS* (1) 0.46 0.59 0.60 (0.42)
Dividend declared per share 0.30 0.36 0.36 0.36
Stock prices:
High $ 46.29 $ 48.16 $ 51.17 $ 43.40
Low 34.40 41.52 42.43 37.99
2013:
Revenue $ 884.3 $ 886.7 $ 890.5 $ 1,006.1
Gross profit (2) 336.4 341.9 347.9 417.8
Operating income (2) 62.3 135.6 60.6 150.8
Net earnings (2) 40.0 94.1 33.7 94.0
Basic EPS* (2) $ 0.63 $ 1.49 $ 0.54 $ 1.51
Diluted EPS* (2) 0.62 1.47 0.53 1.48
Dividend declared per share 0.30 0.30 0.30 0.30
Stock prices:
High $ 28.32 $ 32.19 $ 41.11 $ 38.02
Low 21.79 25.45 31.79 33.31
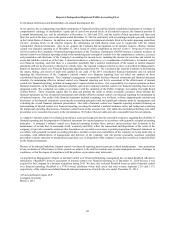
The Company acquired AccessVia and Twistage in March of 2013, Saperion in September of 2013, PACSGEAR in October of 2013, ReadSoft in
August of 2014 and GNAX Health in October of 2014. The consolidated financial results include the results of these acquisitions subsequent to
the date of acquisition. Refer to Note 20 of the Notes to Consolidated Financial Statements for financial information regarding the Perceptive
Software segment, which includes the activities of all acquired businesses.
The sum of the quarterly data may not equal annual amounts due to rounding.
* The sum of the quarterly earnings (loss) per share amounts does not necessarily equal the annual earnings (loss) per share due to changes in
average share calculations. This is in accordance with prescribed reporting requirements.
(1) Net earnings for the first quarter of 2014 included $11.9 million of pre-tax restructuring charges and project costs in connection with the
Company’s restructuring plans and $22.0 million of pre-tax charges in connection with intangible amortization and integration costs associated
with the Company’s acquisitions.
Net earnings for the second quarter of 2014 included $11.8 million of pre-tax restructuring charges and project costs in connection with the
Company’s restructuring plans, $23.5 million of pre-tax charges in connection with intangible amortization and integration costs associated with
the Company’s acquisitions, and a pension and other postretirement benefit plan net gain of $2.9 million.
121


