Lexmark 2014 Annual Report Download - page 46
Download and view the complete annual report
Please find page 46 of the 2014 Lexmark annual report below. You can navigate through the pages in the report by either clicking on the pages listed below, or by using the keyword search tool below to find specific information within the annual report.-
 1
1 -
2
-
3
-
4
-
5
-
6
-
7
-
8
-
9
-
10
-
11
-
12
-
13
-
14
-
15
-
16
-
17
-
18
-
19
-
20
-
21
-
22
-
23
-
24
-
25
-
26
-
27
-
28
-
29
-
30
-
31
-
32
-
33
-
34
-
35
-
 36
36 -
 37
37 -
 38
38 -
 39
39 -
 40
40 -
 41
41 -
 42
42 -
 43
43 -
 44
44 -
 45
45 -
 46
46 -
 47
47 -
 48
48 -
 49
49 -
 50
50 -
 51
51 -
 52
52 -
 53
53 -
 54
54 -
 55
55 -
 56
56 -
57
-
58
-
59
-
60
-
61
-
62
-
63
-
64
-
65
-
66
-
67
-
68
-
69
-
70
-
71
-
72
-
73
-
74
-
75
-
76
-
77
-
78
-
79
-
80
-
81
-
82
-
83
-
84
-
85
-
86
-
87
-
88
-
89
-
90
-
91
-
92
-
93
-
94
-
95
-
96
-
97
-
98
-
99
-
100
-
101
-
102
-
103
-
104
-
105
-
106
-
107
-
108
-
109
-
110
-
111
-
112
-
113
-
114
-
115
-
116
-
117
-
118
-
119
-
120
-
121
-
122
-
123
-
124
-
125
-
126
-
127
-
128
-
129
-
130
-
131
-
132
-
133
-
134
-
135
-
136
-
137
-
138
-
139
-
140
 |
 |

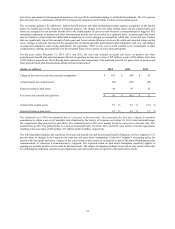
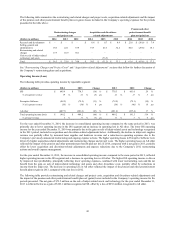
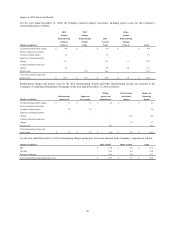
The following table summarizes the restructuring and related charges and project costs, acquisition-related adjustments and the impact
of the pension and other postretirement benefit plan net (gains) losses included in the Company’s operating expenses for the periods
presented in the table above:
Pension and other
Restructuring charges Acquisition and divestiture- postretirement benefit
and project costs related adjustments plan net (gain) loss
(Dollars in millions) 2014 2013 2012 2014 2013 2012 2014 2013 2012
Research and development $ – $ – $ – $ 0.8 $ 0.7 $ 0.9 $ 21.0 $ (36.0) $ 7.4
Selling, general and
administrative 18.6 22.1 37.9
57.7 41.6 32.2 40.6 (29.6) 10.1
Restructuring and related
charges 17.9 10.9 36.1 – – – – – –
Gain on sale of inkjet-related
technology and assets – – – – (73.5) – – – –
Total $ 36.5 $ 33.0 $ 74.0
$ 58.5 $ (31.2) $ 33.1 $ 61.6 $ (65.6) $ 17.5
See “Restructuring Charges and Project Costs” and “Acquisition-related Adjustments” sections that follow for further discussion of
the Company’s restructuring plans and acquisitions.
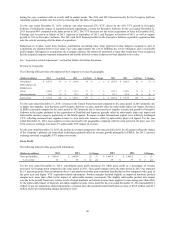
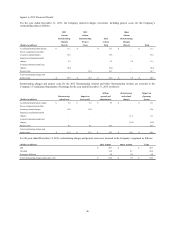
Operating Income (Loss)
The following table provides operating income by reportable segment:
(Dollars in millions) 2014 2013 Change 2013 2012 Change
ISS $ 645.4 $ 770.3 (16) % $ 770.3 $ 601.0 28 %
% of segment revenue 19 % 22 % (3) pts 22 % 17 % 5 pts
Perceptive Software (88.5) (79.5) (11) % (79.5) (72.1) (10) %
% of segment revenue (30) % (36) % 6 pts (36) % (46) % 10 pts
All other (407.7) (281.6) (45) % (281.6) (337.4) 17 %
Total operating income (loss) $ 149.2 $ 409.2 (64) % $ 409.2 $ 191.5 114 %
% of total revenue 4 % 11 % (7) pts 11 % 5 % 6 pts
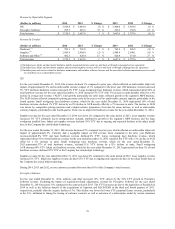
For the year ended December 31, 2014, the decrease in consolidated operating income compared to the same period in 2013, was
primarily due to lower operating income in the ISS segment and an increase in operating loss in All other. The lower ISS operating
income for the year ended December 31, 2014 was primarily due to the gain on sale of inkjet-related assets and technology recognized
in the 2013 period, included in acquisition and divestiture-related adjustments below. Additionally, the decline in inkjet exit supplies
revenue was partially offset by increased laser supplies and hardware revenue and a reduction in operating expenses due to the
Company’s previously announced restructuring and ongoing expense actions. The higher operating losses in Perceptive Software were
driven by higher acquisition-related adjustments and restructuring charges and project costs. The higher operating losses in All other
reflected the impact of the pension and other postretirement benefit plan net loss in 2014, compared with a net gain in 2013, partially
offset by lower acquisition and divestiture-related adjustments and expense reductions due to the Company’s 2012 restructuring
actions and overall expense management.
For the year ended December 31, 2013, the increase in consolidated operating income compared to the same period in 2012, reflected
higher operating income in the ISS segment and a decrease in operating loss in All other. The higher ISS operating income is driven
by improved laser profitability, principally reflecting lower operating expenses, combined with lower restructuring costs and the net
benefit from the gain on sale of inkjet-related technology and assets and other divestiture costs, partially offset by reductions in
income from the inkjet exit. The decrease in operating loss in All other reflected the impact of the pension and other postretirement
benefit plan net gain in 2013, compared with a net loss in 2012.
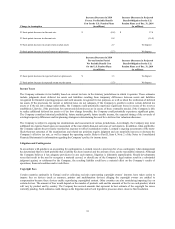
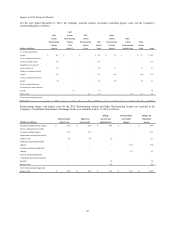
The following table provides restructuring and related charges and project costs, acquisition and divestiture-related adjustments and
the impact of the pension and other postretirement benefit plan net (gains) losses included in the Company’s operating income for the
periods presented. The net gain of $73.5 million on the sale of inkjet-related assets and technology for the year ended December 31,
2013 is reflected below as a gain of $103.1 million recognized in ISS, offset by a loss of $29.6 million recognized in All other.
42