Lexmark 2014 Annual Report Download - page 124
Download and view the complete annual report
Please find page 124 of the 2014 Lexmark annual report below. You can navigate through the pages in the report by either clicking on the pages listed below, or by using the keyword search tool below to find specific information within the annual report.-
 1
1 -
2
-
3
-
4
-
5
-
6
-
7
-
8
-
9
-
10
-
11
-
12
-
13
-
14
-
15
-
16
-
17
-
18
-
19
-
20
-
21
-
22
-
23
-
24
-
25
-
26
-
27
-
28
-
29
-
30
-
31
-
32
-
33
-
34
-
35
-
36
-
37
-
38
-
39
-
40
-
41
-
42
-
43
-
44
-
45
-
46
-
47
-
48
-
49
-
50
-
51
-
52
-
53
-
54
-
55
-
56
-
57
-
58
-
59
-
60
-
61
-
62
-
63
-
64
-
65
-
66
-
67
-
68
-
69
-
70
-
71
-
72
-
73
-
74
-
75
-
76
-
77
-
78
-
79
-
80
-
81
-
82
-
83
-
84
-
85
-
86
-
87
-
88
-
89
-
90
-
91
-
92
-
93
-
94
-
95
-
96
-
97
-
98
-
99
-
100
-
101
-
102
-
103
-
104
-
105
-
106
-
107
-
108
-
109
-
110
-
111
-
112
-
113
-
 114
114 -
 115
115 -
 116
116 -
 117
117 -
 118
118 -
 119
119 -
 120
120 -
 121
121 -
 122
122 -
 123
123 -
 124
124 -
 125
125 -
 126
126 -
 127
127 -
 128
128 -
 129
129 -
 130
130 -
 131
131 -
 132
132 -
 133
133 -
 134
134 -
135
-
136
-
137
-
138
-
139
-
140
 |
 |

Operating income (loss) noted above for the year ended December 31, 2012 includes restructuring charges of $85.5 million in ISS,
$19.1 million in All other, and $0.7 million in Perceptive Software. Operating income (loss) related to Perceptive Software for the
year ended December 31, 2012 includes $40.9 million of amortization expense related to intangible assets acquired by the Company.
All other for the year ended December 31, 2012 includes a pension and other postretirement benefit plan asset and actuarial net loss of
$21.8 million.
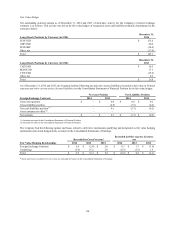
During 2014, 2013 and 2012, no one customer accounted for more than 10% of the Company’s total revenues.
The following is revenue by geographic area for the year ended December 31:
2014 2013 2012
Revenue:
United States $ 1,607.2 $ 1,576.8 $ 1,695.5
EMEA (Europe, the Middle East & Africa) 1,368.8 1,353.5 1,320.3
Other International 734.5 737.3 781.8
Total revenue $ 3,710.5 $ 3,667.6 $ 3,797.6
Sales are attributed to geographic areas based on the location of customers. Other International revenue includes exports from the
U.S. and Europe. In 2014, revenue of $375.8 million is attributed to external customers in Germany, up from $343.7 million in 2013
and $302.7 million in 2012.
The following is long-lived asset information by geographic area as of December 31:
2014 2013
Long-lived assets:
United States $ 476.7 $ 466.2
EMEA (Europe, the Middle East & Africa) 89.4 101.5
Other International 220.0 244.7
Total long-lived assets $ 786.1 $ 812.4
Long-lived assets above include net property, plant and equipment and exclude goodwill and net intangible assets.
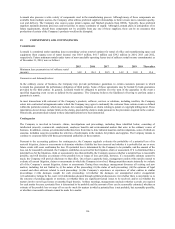
The following is revenue by product category for the year ended December 31:
2014 2013 2012
Revenue:
Hardware (1) $ 782.1 $ 762.8 $ 826.5
Supplies (2) 2,445.9 2,484.4 2,640.1
Software and Other (3) 482.5 420.4 331.0
Total revenue $ 3,710.5 $ 3,667.6 $ 3,797.6
(1) Includes laser, inkjet, and dot matrix hardware and the associated features sold on a unit basis or through a managed service agreement
(2) Includes laser, inkjet, and dot matrix supplies and associated supplies services sold on a unit basis or through a managed service agreement
(3) Includes parts and service related to hardware maintenance and includes software licenses and the associated software maintenance services sold on a unit basis or
as a subscription service
21. SUBSEQUENT EVENTS
On January 2, 2015, the Company acquired substantially all of the assets of Claron in a cash transaction. Refer to Note 4, Business
Combinations and Divestitures, of the Notes to Consolidated Financial Statements regarding details of the Company’s acquisition of
Claron subsequent to the date of the financial statements.
On February 19, 2015, the Company’s Board of Directors approved a quarterly dividend of $0.36 per share of Class A Common
Stock. The dividend is payable March 13, 2015 to stockholders of record on March 2, 2015.
120