Lexmark 2014 Annual Report Download - page 53
Download and view the complete annual report
Please find page 53 of the 2014 Lexmark annual report below. You can navigate through the pages in the report by either clicking on the pages listed below, or by using the keyword search tool below to find specific information within the annual report.-
 1
1 -
2
-
3
-
4
-
5
-
6
-
7
-
8
-
9
-
10
-
11
-
12
-
13
-
14
-
15
-
16
-
17
-
18
-
19
-
20
-
21
-
22
-
23
-
24
-
25
-
26
-
27
-
28
-
29
-
30
-
31
-
32
-
33
-
34
-
35
-
36
-
37
-
38
-
39
-
40
-
41
-
42
-
 43
43 -
 44
44 -
 45
45 -
 46
46 -
 47
47 -
 48
48 -
 49
49 -
 50
50 -
 51
51 -
 52
52 -
 53
53 -
 54
54 -
 55
55 -
 56
56 -
 57
57 -
 58
58 -
 59
59 -
 60
60 -
 61
61 -
 62
62 -
 63
63 -
64
-
65
-
66
-
67
-
68
-
69
-
70
-
71
-
72
-
73
-
74
-
75
-
76
-
77
-
78
-
79
-
80
-
81
-
82
-
83
-
84
-
85
-
86
-
87
-
88
-
89
-
90
-
91
-
92
-
93
-
94
-
95
-
96
-
97
-
98
-
99
-
100
-
101
-
102
-
103
-
104
-
105
-
106
-
107
-
108
-
109
-
110
-
111
-
112
-
113
-
114
-
115
-
116
-
117
-
118
-
119
-
120
-
121
-
122
-
123
-
124
-
125
-
126
-
127
-
128
-
129
-
130
-
131
-
132
-
133
-
134
-
135
-
136
-
137
-
138
-
139
-
140
 |
 |

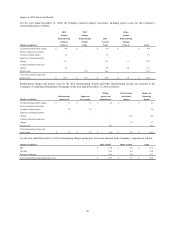
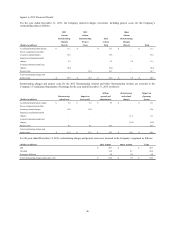
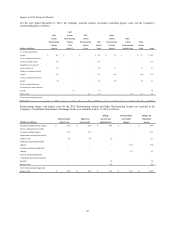
In connection with its acquisitions, the Company incurs acquisition and integration expenses that would not have been incurred
otherwise. The acquisition costs include items such as investment banking fees, legal and accounting fees, and costs of retention bonus
programs for the senior management of the acquired company. Integration costs may consist of information technology expenses
including certain costs for software and systems to be implemented in acquired companies, consulting costs and travel expenses.
Integration costs may also include non-cash charges related to the abandonment of assets under construction by the Company that are
determined to be duplicative of assets of the acquired company and non-cash charges related to certain assets which are abandoned as
systems are integrated across the combined entity. The costs are expensed as incurred, and can vary substantially in size from one
period to the next.
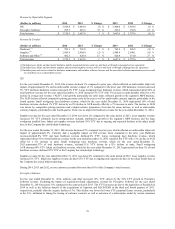
During 2014, 2013 and 2012 the Company incurred $28.6 million, $17.6 million and $18.9 million, respectively, in Selling, general
and administrative on the Company’s Consolidated Statements of Earnings for acquisition and integration costs. The Company
expects pre-tax adjustments for acquisition and integration expenses of approximately $31 million for 2015.
Divestiture Activity
Refer to Part II, Item 8, Note 4 of the Notes to Consolidated Financial Statements for information regarding the gain recognized upon
sale of inkjet-related technology and assets.
In connection with the sale of the Company’s inkjet-related technology and assets, the Company incurred expenses that would not
have been incurred otherwise. Divestiture-related costs consist of employee travel expenses and compensation, consulting costs,
training costs and transition services including non-cash charges related to assets used in providing the transition services. These costs
are incremental to normal operating charges and are expensed as incurred. The Company incurred $1.7 million and $4.3 million in
Selling, general and administrative on the Company’s Consolidated Statements of Earnings in 2014 and 2013, respectively, for
divestiture-related costs. The Company expects future divestiture-related expenses to be immaterial.
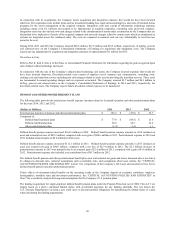
PENSION AND OTHER POSTRETIREMENT PLANS
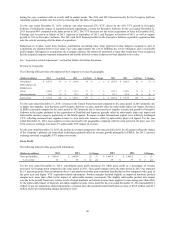
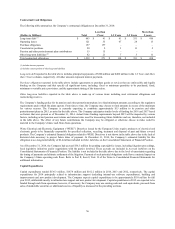
The following table provides the total pre-tax benefit expense (income) related to Lexmark’s pension and other postretirement plans
for the years 2014, 2013, and 2012.
(Dollars in Millions) 2014 2013 2012
Total expense (income) of pension and other postretirement plans $ 105.2 $ (59.6) $ 52.7
Comprised of:
Defined benefit pension plans $ 77.8 $ (86.5) $ 25.6
Defined contribution plans 28.8 28.3 26.0
Other postretirement plans (1.4) (1.4) 1.1
Defined benefit pension expense increased $164.3 million in 2014. Defined benefit pension expense amounts in 2014 included an
asset and actuarial net loss of $82.9 million, compared with a net gain of $80.6 million in 2013. Postretirement expense in 2014 and
2013 included actuarial gains of $2.4 million for both years.
Defined benefit pension expense decreased $112.1 million in 2013. Defined benefit pension expense amounts in 2013 included an
asset and actuarial net gain of $80.6 million, compared with a net loss of $23.4 million in 2012. The $2.5 million decrease in
postretirement expense in 2013 was primarily due to an actuarial gain of $2.4 million in 2013, compared with a gain of $1.6 million in
2012. Postretirement expense also included a net curtailment loss of $0.7 million in 2012.
The defined benefit pension and other postretirement benefit plan asset and actuarial net gains and losses discussed above are driven
by changes in discount rates, actuarial assumptions such as mortality rates, and assumptions about asset returns. See “CRITICAL
ACCOUNTING POLICIES AND ESTIMATES” in Item 7 for components of the Company’s 2014 asset and actuarial net loss for its
defined benefit pension and other postretirement plans.
Future effects of retirement-related benefits on the operating results of the Company depend on economic conditions, employee
demographics, mortality rates and investment performance. See “CRITICAL ACCOUNTING POLICIES AND ESTIMATES” in
Item 7 for a sensitivity analysis for long-term assumptions for the Company’s U.S. pension plans.
The funding requirement for single-employer defined benefit pension plans under the Pension Protection Act of 2006 (“the Act”) are
largely based on a plan’s calculated funded status, with accelerated payments for any funding shortfalls. The Act directs the
U.S. Treasury Department to develop a new yield curve to discount pension obligations for determining the funded status of a plan
when calculating the funding requirements.
49