Lexmark 2014 Annual Report Download - page 115
Download and view the complete annual report
Please find page 115 of the 2014 Lexmark annual report below. You can navigate through the pages in the report by either clicking on the pages listed below, or by using the keyword search tool below to find specific information within the annual report.-
 1
1 -
2
-
3
-
4
-
5
-
6
-
7
-
8
-
9
-
10
-
11
-
12
-
13
-
14
-
15
-
16
-
17
-
18
-
19
-
20
-
21
-
22
-
23
-
24
-
25
-
26
-
27
-
28
-
29
-
30
-
31
-
32
-
33
-
34
-
35
-
36
-
37
-
38
-
39
-
40
-
41
-
42
-
43
-
44
-
45
-
46
-
47
-
48
-
49
-
50
-
51
-
52
-
53
-
54
-
55
-
56
-
57
-
58
-
59
-
60
-
61
-
62
-
63
-
64
-
65
-
66
-
67
-
68
-
69
-
70
-
71
-
72
-
73
-
74
-
75
-
76
-
77
-
78
-
79
-
80
-
81
-
82
-
83
-
84
-
85
-
86
-
87
-
88
-
89
-
90
-
91
-
92
-
93
-
94
-
95
-
96
-
97
-
98
-
99
-
100
-
101
-
102
-
103
-
104
-
 105
105 -
 106
106 -
 107
107 -
 108
108 -
 109
109 -
 110
110 -
 111
111 -
 112
112 -
 113
113 -
 114
114 -
 115
115 -
 116
116 -
 117
117 -
 118
118 -
 119
119 -
 120
120 -
 121
121 -
 122
122 -
 123
123 -
 124
124 -
 125
125 -
126
-
127
-
128
-
129
-
130
-
131
-
132
-
133
-
134
-
135
-
136
-
137
-
138
-
139
-
140
 |
 |

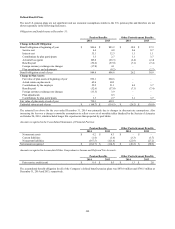
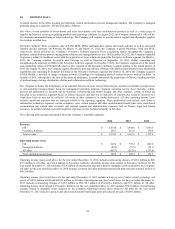
The following table sets forth by level, within the fair value hierarchy, plan assets measured at fair value on a recurring basis as of
December 31, 2014 and 2013:
December 31, 2014 December 31, 2013
Level 1 Level 2 Level 3 Total Level 1 Level 2 Level 3 Total
Commingled trust
funds:
Fixed income $ – $ 251.1 $ – $ 251.1 $ – $ 210.1 $ – $ 210.1
International equity
large-cap – 82.3 – 82.3 – 92.9 – 92.9
International equity
small-cap – 17.3 – 17.3 – 20.8 – 20.8
Emerging market
equity – 21.7 – 21.7 – 24.5 – 24.5
Emerging market
debt – 25.7 – 25.7 – 26.6 – 26.6
Global equity – 36.0 – 36.0 – 39.2 – 39.2
U.S. equity – 83.0 – 83.0 – 89.8 – 89.8
Real estate – 5.1 – 5.1 – 4.8 – 4.8
Fixed income:
Government and
agency debt
securities – 33.4 – 33.4 – 33.0 – 33.0
Corporate debt
securities – 144.1 1.2 145.3 – 133.0 1.6 134.6
Asset-backed and
mortgage-backed
securities – 9.7 3.1 12.8 – 11.1 2.5 13.6
U.S. equity securities:
Cash equivalent – 4.4 – 4.4 – 2.3 – 2.3
Subtotal – 713.8 4.3 718.1 – 688.1 4.1 692.2
Cash – – – 2.0 – – – 2.2
Employer and
benefits payable – – – – – – – (2.3)
Total assets at fair
value $ – $ 713.8 $ 4.3 $ 720.1 $ – $ 688.1 $ 4.1 $ 692.1
The following table sets forth a summary of changes in the fair value of Level 3 assets at December 31:
2014 2013
Total
Fixed Income
- Corporate
debt securities
Fixed Income
- Asset-backed
and mortgage-
backed
securities Total
Fixed Income
- Corporate
debt securities
Fixed Income
- Asset-
backed and
mortgage-
backed
securities
Fair value at beginning of
year $ 4.1 $ 1.6 $ 2.5 $ 2.0 $ 2.0 $ –
Actual return on plan assets -
assets held at reporting date 0.1 0.1 – – – –
Actual return on plan assets -
assets sold during period – – – (0.1) – (0.1)
Purchases, sales and
settlements, net 0.1 (0.5) 0.6 2.6 – 2.6
Transfers in/(transfers out),
net – – – (0.4) (0.4) –
Fair value at end of year $ 4.3 $ 1.2 $ 3.1 $ 4.1 $ 1.6 $ 2.5
111