Lexmark 2014 Annual Report Download - page 54
Download and view the complete annual report
Please find page 54 of the 2014 Lexmark annual report below. You can navigate through the pages in the report by either clicking on the pages listed below, or by using the keyword search tool below to find specific information within the annual report.-
 1
1 -
2
-
3
-
4
-
5
-
6
-
7
-
8
-
9
-
10
-
11
-
12
-
13
-
14
-
15
-
16
-
17
-
18
-
19
-
20
-
21
-
22
-
23
-
24
-
25
-
26
-
27
-
28
-
29
-
30
-
31
-
32
-
33
-
34
-
35
-
36
-
37
-
38
-
39
-
40
-
41
-
42
-
43
-
 44
44 -
 45
45 -
 46
46 -
 47
47 -
 48
48 -
 49
49 -
 50
50 -
 51
51 -
 52
52 -
 53
53 -
 54
54 -
 55
55 -
 56
56 -
 57
57 -
 58
58 -
 59
59 -
 60
60 -
 61
61 -
 62
62 -
 63
63 -
 64
64 -
65
-
66
-
67
-
68
-
69
-
70
-
71
-
72
-
73
-
74
-
75
-
76
-
77
-
78
-
79
-
80
-
81
-
82
-
83
-
84
-
85
-
86
-
87
-
88
-
89
-
90
-
91
-
92
-
93
-
94
-
95
-
96
-
97
-
98
-
99
-
100
-
101
-
102
-
103
-
104
-
105
-
106
-
107
-
108
-
109
-
110
-
111
-
112
-
113
-
114
-
115
-
116
-
117
-
118
-
119
-
120
-
121
-
122
-
123
-
124
-
125
-
126
-
127
-
128
-
129
-
130
-
131
-
132
-
133
-
134
-
135
-
136
-
137
-
138
-
139
-
140
 |
 |

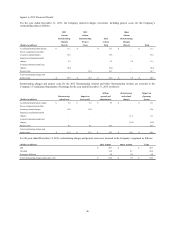
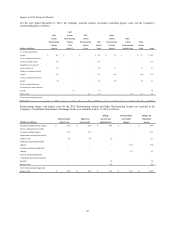
Refer to Part II, Item 8, Note 17 of the Notes to Consolidated Financial Statements for additional information relating to the
Company’s pension and other postretirement plans.
LIQUIDITY AND CAPITAL RESOURCES
Financial Position
Lexmark’s financial position remains strong at December 31, 2014, with working capital of $623.0 million compared to $823.4
million at December 31, 2013. The $200.4 million decrease in working capital accounts is mainly driven by net cash used to acquire
ReadSoft totaling $234.2. The Company also repurchased shares in the amount of $80.0 million and made cash dividend payments of
$85.3 million during 2014. These uses were offset by strong cash operating cash flows. Cash cycle performance experienced an
improvement of 10 days over the prior year.
At December 31, 2014 and December 31, 2013, the Company had senior note debt of $699.7 million and $699.6 million, respectively.
The Company had no amounts outstanding under its U.S. trade receivables financing program or its revolving credit facility at
December 31, 2014 and December 31, 2013.
The debt to total capital ratio was stable at 36% at December 31, 2014 and 34% at December 31, 2013. The debt to total capital ratio is
calculated by dividing the Company’s outstanding debt by the sum of its outstanding debt and total stockholders’ equity.
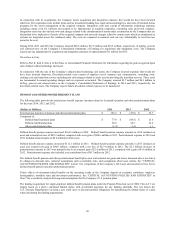
Liquidity
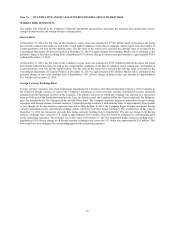
The following table summarizes the Company’s Consolidated Statements of Cash Flows for the years indicated:
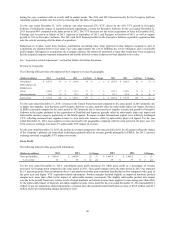
(Dollars in millions) 2014 2013 2012
Net cash flow provided by (used for):
Operating activities $ 423.0 $ 480.0 $ 421.3
Investing activities (56.0) (309.4) (302.5)
Financing activities (323.7) (107.7) (263.4)
Effect of exchange rate changes on cash (7.2) (2.1) 0.9
Net change in cash and cash equivalents $ 36.1 $ 60.8 $ (143.7)
The Company’s primary source of liquidity has been cash generated by operations, which totaled $423.0 million, $480.0 million, and
$421.3 million in 2014, 2013, and 2012, respectively. Cash from operations generally has been sufficient to allow the Company to
fund its working capital needs and finance its capital expenditures and acquisitions. Management believes that cash provided by
operations will continue to be sufficient on a worldwide basis to meet operating and capital needs as well as the funding of expected
dividends and share repurchases for the next twelve months. However, in the event that cash from operations is not sufficient, the
Company has substantial cash and cash equivalents and current marketable securities balances and other potential sources of liquidity
through utilization of its trade receivables financing program and revolving credit facility or access to the private and public debt
markets. The Company may choose to use these sources of liquidity from time to time, including during 2015, to fund strategic
acquisitions, dividends, and/or share repurchases.
As of December 31, 2014, the Company held $933.9 million in Cash and cash equivalents and current Marketable securities. The
Company’s ability to fund operations from this balance could be limited by the liquidity in the market as well as possible tax
implications of moving proceeds across jurisdictions. Of this amount, approximately $875.5 million of Cash and cash equivalents and
current Marketable securities were held by foreign subsidiaries. The Company utilizes a variety of financing strategies with the
objective of having its worldwide cash available in the locations where it is needed. However, if amounts held by foreign subsidiaries
were needed to fund operations in the U.S., the Company could be required to accrue and pay taxes to repatriate a large portion of
these funds. The Company’s intent is to permanently reinvest undistributed earnings of low tax rate foreign subsidiaries and current
plans do not demonstrate a need to repatriate them to fund operations in the U.S.
As of December 31, 2013, the Company held $1,054.7 million in Cash and cash equivalents and current Marketable securities. Of this
amount, approximately $1,014.5 million of Cash and cash equivalents and current Marketable securities were held by foreign
subsidiaries.
A discussion of the Company’s additional sources of liquidity is included in the Financing activities section to follow.
50