Lexmark 2014 Annual Report Download - page 47
Download and view the complete annual report
Please find page 47 of the 2014 Lexmark annual report below. You can navigate through the pages in the report by either clicking on the pages listed below, or by using the keyword search tool below to find specific information within the annual report.-
 1
1 -
2
-
3
-
4
-
5
-
6
-
7
-
8
-
9
-
10
-
11
-
12
-
13
-
14
-
15
-
16
-
17
-
18
-
19
-
20
-
21
-
22
-
23
-
24
-
25
-
26
-
27
-
28
-
29
-
30
-
31
-
32
-
33
-
34
-
35
-
36
-
 37
37 -
 38
38 -
 39
39 -
 40
40 -
 41
41 -
 42
42 -
 43
43 -
 44
44 -
 45
45 -
 46
46 -
 47
47 -
 48
48 -
 49
49 -
 50
50 -
 51
51 -
 52
52 -
 53
53 -
 54
54 -
 55
55 -
 56
56 -
 57
57 -
58
-
59
-
60
-
61
-
62
-
63
-
64
-
65
-
66
-
67
-
68
-
69
-
70
-
71
-
72
-
73
-
74
-
75
-
76
-
77
-
78
-
79
-
80
-
81
-
82
-
83
-
84
-
85
-
86
-
87
-
88
-
89
-
90
-
91
-
92
-
93
-
94
-
95
-
96
-
97
-
98
-
99
-
100
-
101
-
102
-
103
-
104
-
105
-
106
-
107
-
108
-
109
-
110
-
111
-
112
-
113
-
114
-
115
-
116
-
117
-
118
-
119
-
120
-
121
-
122
-
123
-
124
-
125
-
126
-
127
-
128
-
129
-
130
-
131
-
132
-
133
-
134
-
135
-
136
-
137
-
138
-
139
-
140
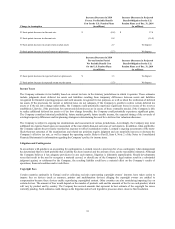
 |
 |

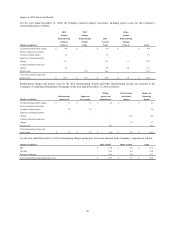
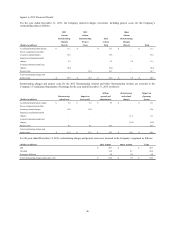
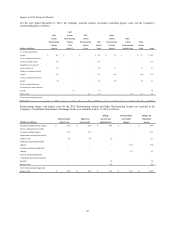
Pension and other
Restructuring charges and Acquisition and divestiture- postretirement benefit plan
project costs related adjustments net (gain) loss
(Dollars in millions) 2014 2013 2012 2014 2013 2012 2014 2013 2012
ISS $ 15.9 $ 29.7 $ 92.6 $ 2.2 $ (98.7) $ – $ – $ – $ –
Perceptive Software 11.3 4.8 0.7 91.7 72.8 46.9 – – –
All other 18.6 20.0 28.5 26.9 47.1 18.9 80.5 (83.0) 21.8
Total $ 45.8 $ 54.5 $ 121.8
$ 120.8 $ 21.2 $ 65.8 $ 80.5 $ (83.0) $ 21.8
See “Restructuring Charges and Project Costs” and “Acquisition-related Adjustments” sections that follow for further discussion.
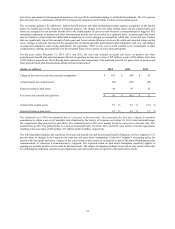
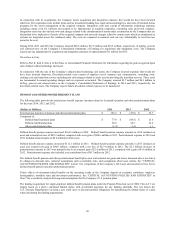
Interest and Other
The following table provides interest and other information:
(Dollars in millions) 2014 2013 2012
Interest expense, net $ 31.6 $ 33.0 $ 29.6
Other expense (income), net 4.2 4.5 (0.5)
Loss on extinguishment of debt – 3.3 –
Total interest and other expense (income), net $ 35.8 $ 40.8 $ 29.1
During 2014, total interest and other expense (income) net, decreased 12% compared to the same period in 2013, primarily due to the
loss on extinguishment of debt included in the 2013 period and lower net interest expense. The loss of $3.3 million on extinguishment
of debt in 2013 is comprised of $3.2 million of premium paid upon repayment of the Company’s 2013 senior notes and $0.1 million
related to the write-off of related debt issuance costs. During 2013, total interest and other (income) expense, net, increased 40%
compared to the same period in 2012.
Provision for Income Taxes and Related Matters
The Company’s effective income tax rate was approximately 30.2%, 28.9% and 33.8% in 2014, 2013 and 2012, respectively. Refer to
Part II, Item 8, Note 14 of the Notes to Consolidated Financial Statements for a reconciliation of the Company’s effective tax rate to
the U.S. statutory rate.
The 1.3 percentage point increase of the effective tax rate from 2013 to 2014 was primarily due to the following factors: an increase
due to a geographic shift in earnings away from lower tax jurisdictions in 2014; an increase due to the 2012 research and development
credit being recorded in 2013; a decrease due to various adjustments to previously accrued taxes; and an increase due to an adjustment
for the realizability of a deferred tax asset in 2014.
The 4.9 percentage point decrease of the effective tax rate from 2012 to 2013 was due primarily to a geographic shift in earnings
toward lower tax jurisdictions in 2013, and to the reenactment of the U.S. research and experimentation tax credit in 2013 for the 2012
tax year.
In January of 2013, the President signed into law The American Taxpayer Relief Act of 2012, which contained provisions that
retroactively extended the U.S. research and experimentation tax credit to January 1, 2012. Because the extension did not happen by
December 31, 2012, the Company’s effective income tax rate for 2012 did not include the benefit of the credit for that year. However,
because the credit was retroactively extended to include 2012, the Company recognized the full benefit of the 2012 credit in the first
quarter of 2013.
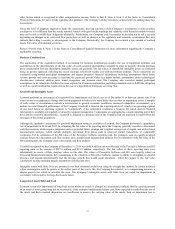
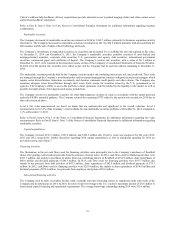
Net Earnings and Earnings per Share
The following table summarizes net earnings and basic and diluted net earnings per share:
(Dollars in millions, except per share amounts) 2014 2013 2012
Net earnings $ 79.1 $ 261.8 $ 107.6
Basic earnings per share $ 1.28 $ 4.16 $ 1.57
Diluted earnings per share $ 1.25 $ 4.08 $ 1.55
43