Lexmark 2014 Annual Report Download - page 55
Download and view the complete annual report
Please find page 55 of the 2014 Lexmark annual report below. You can navigate through the pages in the report by either clicking on the pages listed below, or by using the keyword search tool below to find specific information within the annual report.-
 1
1 -
2
-
3
-
4
-
5
-
6
-
7
-
8
-
9
-
10
-
11
-
12
-
13
-
14
-
15
-
16
-
17
-
18
-
19
-
20
-
21
-
22
-
23
-
24
-
25
-
26
-
27
-
28
-
29
-
30
-
31
-
32
-
33
-
34
-
35
-
36
-
37
-
38
-
39
-
40
-
41
-
42
-
43
-
44
-
 45
45 -
 46
46 -
 47
47 -
 48
48 -
 49
49 -
 50
50 -
 51
51 -
 52
52 -
 53
53 -
 54
54 -
 55
55 -
 56
56 -
 57
57 -
 58
58 -
 59
59 -
 60
60 -
 61
61 -
 62
62 -
 63
63 -
 64
64 -
 65
65 -
66
-
67
-
68
-
69
-
70
-
71
-
72
-
73
-
74
-
75
-
76
-
77
-
78
-
79
-
80
-
81
-
82
-
83
-
84
-
85
-
86
-
87
-
88
-
89
-
90
-
91
-
92
-
93
-
94
-
95
-
96
-
97
-
98
-
99
-
100
-
101
-
102
-
103
-
104
-
105
-
106
-
107
-
108
-
109
-
110
-
111
-
112
-
113
-
114
-
115
-
116
-
117
-
118
-
119
-
120
-
121
-
122
-
123
-
124
-
125
-
126
-
127
-
128
-
129
-
130
-
131
-
132
-
133
-
134
-
135
-
136
-
137
-
138
-
139
-
140
 |
 |
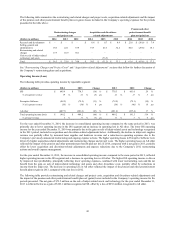
Operating activities
The Company continues to generate significant annual cash flow from operations. Earnings and cash flow from operations in 2014
were $79.1 million and $423.0 million, respectively.
The $57.0 million decrease in cash flow from operating activities from 2013 to 2014 was driven by the following factors.
The decrease in Net earnings of $182.7 million from 2013 was affected by the non-cash YTY impact of Pension and other
postretirement expense (income) of $164.3 and the Gain on the sale of inkjet-related technology and assets of $75.3 million. This was
somewhat offset by deferred taxes related to the Pension and other postretirement expense (income) of approximately $36 million.
The unfavorable YTY change in Accrued liabilities and in Other assets and liabilities, collectively, was $146.3 million comparing
2014 to 2013. The largest factors behind the YTY movement were compensation related. Incentive compensation payments were $49
million more in 2014 than 2013. Based on payroll timing, the Company had an extra pay period in 2014 which had an unfavorable
cash flow impact of approximately $16 million. The Company settled a legal matter resulting in an unfavorable change of $14.4
million in 2014. Reimbursements for certain retiree medical expenses were down by $12.0 million due to aged items being fully
collected in 2013. Marketing program accruals drove unfavorable cash flows of $37.8 million in 2014 compared to 2013 driven by
claim payouts. Net VAT taxes also drove another $8.5 million in unfavorable operating cash flows.
Trade receivables balances decreased $60.7 million in 2014 while they decreased $78.3 million in 2013. This $17.6 million
fluctuation between the activity in 2014 and that of 2013 is driven largely by collection efforts in 2013 which continued in 2014. This
is evidenced by the days of sales outstanding, which dropped 9 days in 2013 but only 3 additional days in 2014.
The activities above were partially offset by the following factors.
Accounts payable increased $55.7 million in 2014 while they decreased $38.3 million in 2013 resulting in a favorable impact to
operating cash flows of $94.0 million. The increase in 2014 is driven by increased purchasing activities late in the year compared to
2013.
Refer to the contractual cash obligations table that follows for additional information regarding items that will likely impact the
Company’s future cash flows.
The $58.7 million increase in cash flow from operating activities from 2012 to 2013 was driven by the following factors.
Trade receivables balance decreased $78.3 million in 2013 while they increased $57.2 million in 2012, excluding receivables
recognized from business combinations. This $135.5 million fluctuation between the activity in 2013 and that of 2012 is driven largely
by timing of sales as well as a decrease in days sales outstanding. The decrease in days sales outstanding reflects improved collection
efforts.
The favorable YTY change in Accrued liabilities and in Other assets and liabilities, collectively, was $66.5 million comparing 2013 to
2012. The largest factors behind the YTY movement included increased incentive compensation accruals and marketing program
accruals. Annual incentive compensation accruals, which were paid in 2014, were up approximately $49 million in 2013 compared to
2012. Marketing program accruals increased $24 million in 2013 compared to a $10 million decrease in 2012. Cash paid for income
taxes had a negative impact on cash flows from operations as detailed in Part II, Item 8, Note 14 of the Notes to Consolidated
Financial Statements. The negative impact for cash paid from income taxes was partially offset by other tax related accruals.
The activities above were partially offset by the following factors.
Although Net Earnings increased $154.2 million for the full year 2013 as compared to the full year 2012, the YTY increase in Net
Earnings was affected by the non-cash Pension and other postretirement income (expense) and Gain on the sale of inkjet-related
technology and assets of $114.6 million and $75.3 million, respectively.
Accounts payable decreased $38.3 million in 2013 while they increased $22.0 million in 2012. The decrease in 2013 is driven by the
exit of inkjet business and utilization of on-hand inventory.
Inventories decreased $7.3 million in 2013 and $58.2 million in 2012. This reflects continued improvement in inventory management
and reduced inventory levels due to exit of inkjet business.
51