LG 2004 Annual Report Download - page 93
Download and view the complete annual report
Please find page 93 of the 2004 LG annual report below. You can navigate through the pages in the report by either clicking on the pages listed below, or by using the keyword search tool below to find specific information within the annual report.-
 1
1 -
2
-
3
-
4
-
5
-
6
-
7
-
8
-
9
-
10
-
11
-
12
-
13
-
14
-
15
-
16
-
17
-
18
-
19
-
20
-
21
-
22
-
23
-
24
-
25
-
26
-
27
-
28
-
29
-
30
-
31
-
32
-
33
-
34
-
35
-
36
-
37
-
38
-
39
-
40
-
41
-
42
-
43
-
44
-
45
-
46
-
47
-
48
-
49
-
50
-
51
-
52
-
53
-
54
-
55
-
56
-
57
-
58
-
59
-
60
-
61
-
62
-
63
-
64
-
65
-
66
-
67
-
68
-
69
-
70
-
71
-
72
-
73
-
74
-
75
-
76
-
77
-
78
-
79
-
80
-
81
-
82
-
 83
83 -
 84
84 -
 85
85 -
 86
86 -
 87
87 -
 88
88 -
 89
89 -
 90
90 -
 91
91 -
 92
92 -
 93
93 -
 94
94 -
 95
95 -
 96
96 -
 97
97 -
 98
98 -
 99
99 -
 100
100 -
 101
101 -
 102
102 -
 103
103 -
104
-
105
-
106
-
107
-
108
-
109
-
110
-
111
-
112
-
113
-
114
-
115
-
116
-
117
-
118
-
119
-
120
-
121
-
122
-
123
-
124
-
125
-
126
-
127
-
128
-
129
 |
 |

LG Electronics Inc.
Notes to Non-Consolidated Financial Statements
December 31, 2004 and 2003
LG ELECTRONICS ANNUAL REPORT 2004
092
093
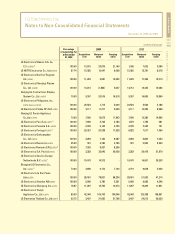
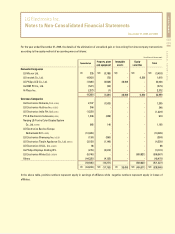
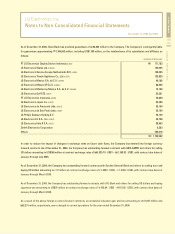
11. Property, Plant and Equipment
Changes in property, plant and equipment for the year ended December 31, 2004, are as follows:
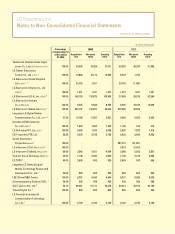
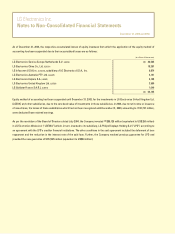
Changes in property, plant and equipment for the year ended December 31, 2003, were as follows:
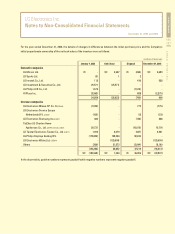
As of December 31, 2004, the value of the Company’s land, as determined by the local government in Korea for property tax
assessment purposes, approximates 770,545 million (2003: 676,051 million).
A substantial portion of property, plant and equipment as of December 31, 2004 is pledged as collateral for short-term borrowings and
long-term debt from Korea Development Bank, up to a maximum of approximately 883,461 million. The said amount includes the
equivalent of US$99 million, JP 150 million and EUR360 million (Notes 14 and 15).
(in millions of Korean won)
Disposals
(3,018)
(4,530)
(694)
(23,456)
(106,381)
(6,823)
(2,733)
(9)
-
(147,644)
Transfer-in
(out)
4
219,662
8,565
181,176
21,567
2,553
910
(400,505)
(33,933)
(1)
Acquisitions
and capital
expenditure
465
23,563
4,965
177,075
233,757
111,110
3,839
524,891
33,768
1,113,433
Balance at
January
1, 2004
707,683
905,935
65,577
634,708
399,837
207,633
8,088
184,926
8,333
3,122,720
Accumulated
depreciation
at December
31, 2004
-
185,867
37,156
721,582
300,941
350,009
10,206
-
-
1,605,761
Balance at
December
31, 2004
705,134
1,115,424
73,512
754,610
425,290
230,695
7,413
309,303
8,168
3,629,549
Depreciation
-
(29,206)
(4,901)
(214,893)
(123,490)
(83,778)
(2,691)
-
-
(458,959)
Land
Buildings
Structures
Machinery and equipment
Tools
Furniture and fixtures
Vehicles
Construction-in-progress
Machinery-in-transit
Total
(in millions of Korean won)
Disposals
(10,785)
(23,981)
(1,876)
(28,582)
(29,051)
(5,784)
(300)
(775)
-
(101,134)
Transfer-in
(out)
(9)
42,996
653
176,530
39,324
9,553
273
(130,420)
(165,147)
(26,247)
Acquisitions
and capital
expenditure
12,497
31,556
4,058
79,820
169,476
83,370
3,743
210,459
164,020
758,999
Balance at
January
1, 2003
705,980
882,219
67,740
563,864
345,816
205,579
7,052
105,662
9,460
2,893,372
Accumulated
depreciation
at December
31, 2003
-
157,337
32,345
580,176
299,847
318,917
12,532
-
-
1,401,154
Balance at
December
31, 2003
707,683
905,935
65,577
634,708
399,837
207,633
8,088
184,926
8,333
3,122,720
Depreciation
-
(26,855)
(4,998)
(156,924)
(125,728)
(85,085)
(2,680)
-
-
(402,270)
Land
Buildings
Structures
Machinery and equipment
Tools
Furniture and fixtures
Vehicles
Construction-in-progress
Machinery-in-transit
Total