LG 2004 Annual Report Download - page 121
Download and view the complete annual report
Please find page 121 of the 2004 LG annual report below. You can navigate through the pages in the report by either clicking on the pages listed below, or by using the keyword search tool below to find specific information within the annual report.-
 1
1 -
2
-
3
-
4
-
5
-
6
-
7
-
8
-
9
-
10
-
11
-
12
-
13
-
14
-
15
-
16
-
17
-
18
-
19
-
20
-
21
-
22
-
23
-
24
-
25
-
26
-
27
-
28
-
29
-
30
-
31
-
32
-
33
-
34
-
35
-
36
-
37
-
38
-
39
-
40
-
41
-
42
-
43
-
44
-
45
-
46
-
47
-
48
-
49
-
50
-
51
-
52
-
53
-
54
-
55
-
56
-
57
-
58
-
59
-
60
-
61
-
62
-
63
-
64
-
65
-
66
-
67
-
68
-
69
-
70
-
71
-
72
-
73
-
74
-
75
-
76
-
77
-
78
-
79
-
80
-
81
-
82
-
83
-
84
-
85
-
86
-
87
-
88
-
89
-
90
-
91
-
92
-
93
-
94
-
95
-
96
-
97
-
98
-
99
-
100
-
101
-
102
-
103
-
104
-
105
-
106
-
107
-
108
-
109
-
110
-
 111
111 -
 112
112 -
 113
113 -
 114
114 -
 115
115 -
 116
116 -
 117
117 -
 118
118 -
 119
119 -
 120
120 -
 121
121 -
 122
122 -
 123
123 -
 124
124 -
 125
125 -
 126
126 -
 127
127 -
 128
128 -
 129
129
 |
 |

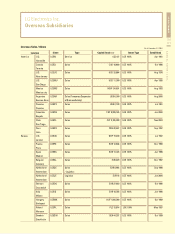
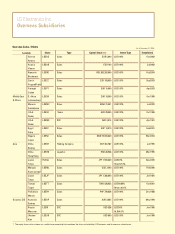
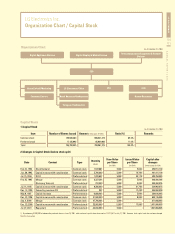
LG Electronics Inc.
Organization Chart / Capital Stock
LG ELECTRONICS ANNUAL REPORT 2004
120
121
Digital Appliance Division Digital Display & Media Division
CEO
Telecommunication Equipment & Handset
Division
Korea Sales & Marketing
Customer Service
LG Electronics China
North American Headquarters
European Headquarters
CTO CFO
Human Resources
Organization Chart
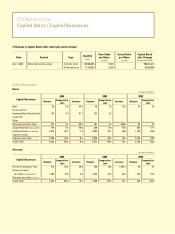
Capital Stock
1) Capital Stock
Item
Common stock
Preferred stock
Total
Ratio (%)
89.0%
11.0%
100.0%
RemarksNumber of Shares Issued
139,606,263
17,185,992
156,792,255
Amount (In thousands of KRW)
698,031,315
85,929,960
783,961,275
2) Changes in Capital Stock (before stock split)
1) By redeeming 32,000,000 of redeemable preferred shares in June 29, 2001, total number of capital share decreased to 174,213,617 in July 27, 2001. However, total capital stock has not been changed
from this transaction.
Date Content Type Quantity
(share)
Face Value
per Share
(In KRW)
Issued Value
per Share
(In KRW)
Feb. 27, 1993 Stock Dividend Common stock 1,572,681 5,000 5,000 452,911,100
Jun. 26, 1993 Capital increase with consideration Common stock 5,700,000 5,000 10,100 481,411,100
Jul. 15, 1994 G D R Preferred stock 1,870,657 5,000 30,179 490,764,385
Feb. 25, 1995 Merger Common stock 2,327,304 5,000 5,000 502,400,905
(Kumsung Telecom) Preferred stock 212,230 5,000 5,000 503,462,055
Jul. 14, 1995 Capital increase with consideration Common stock 6,300,000 5,000 21,700 534,962,055
Dec. 14, 1995 Converting overseas CB Preferred stock 207 5,000 17,493 534,963,090
May 6, 1997 Capital decrease Preferred stock -2,069,405 5,000 5,000 524,616,065
Dec. 24, 1998 Capital increase with consideration Common stock 21,500,000 5,000 8,800 632,116,065
Sep. 4, 2000 Merger Common stock 47,790,404 5,000 871,068,085
Dec. 23, 2000 Capital increase with consideration Preferred stock 32,000,000 5,000 17,000 1,031,068,085
Jul. 27, 2001 Repayment Preferred stock -32,000,000 5,000 1,031,068,085
Capital after
changes
(In thousands of KRW)
(As of December 31, 2004)
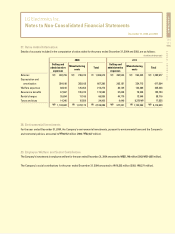
(as of December 31, 2004)