LG 2004 Annual Report Download - page 41
Download and view the complete annual report
Please find page 41 of the 2004 LG annual report below. You can navigate through the pages in the report by either clicking on the pages listed below, or by using the keyword search tool below to find specific information within the annual report.-
 1
1 -
2
-
3
-
4
-
5
-
6
-
7
-
8
-
9
-
10
-
11
-
12
-
13
-
14
-
15
-
16
-
17
-
18
-
19
-
20
-
21
-
22
-
23
-
24
-
25
-
26
-
27
-
28
-
29
-
30
-
 31
31 -
 32
32 -
 33
33 -
 34
34 -
 35
35 -
 36
36 -
 37
37 -
 38
38 -
 39
39 -
 40
40 -
 41
41 -
 42
42 -
 43
43 -
 44
44 -
 45
45 -
 46
46 -
 47
47 -
 48
48 -
 49
49 -
 50
50 -
 51
51 -
52
-
53
-
54
-
55
-
56
-
57
-
58
-
59
-
60
-
61
-
62
-
63
-
64
-
65
-
66
-
67
-
68
-
69
-
70
-
71
-
72
-
73
-
74
-
75
-
76
-
77
-
78
-
79
-
80
-
81
-
82
-
83
-
84
-
85
-
86
-
87
-
88
-
89
-
90
-
91
-
92
-
93
-
94
-
95
-
96
-
97
-
98
-
99
-
100
-
101
-
102
-
103
-
104
-
105
-
106
-
107
-
108
-
109
-
110
-
111
-
112
-
113
-
114
-
115
-
116
-
117
-
118
-
119
-
120
-
121
-
122
-
123
-
124
-
125
-
126
-
127
-
128
-
129
 |
 |

LG ELECTRONICS ANNUAL REPORT 2004
040
041
The following analysis of financial information is based on non-consolidated financial statements that comply with
Korean GAAP. In addition, this section contains forward-looking statements regarding the financial condition, results
of operations, general business strategies, and the plans and objectives of the LG Electronics’ management. Such
statements involve known and unknown risks, uncertainties, and other factors, which may make the future results or
performance differ from the results expressed or implied therein. LG Electronics does not make any representation or
warranty, expressed or implied, as to the accuracy or completeness of the information contained in this management
section, and nothing contained herein is, or shall be relied upon as a promise, whether as to the past, present or future.
Such forward-looking statements were made based on current plans, estimates, and projections of the Company and
the political and economic environment in which LG Electronics will foreseeably operate in the future, and therefore
you should not place undue reliance on them. The figures of 2003 and 2004 reflect the organizational changes in 2005,
and were readjusted to conform with the following four divisions: Mobile Communications Division, Digital Appliance
Division, Digital Display Division, and Digital Media Division.
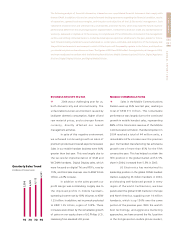
BUSINESS RESULTS IN 2004
�2004 was a challenging year for us,
both domestically and internationally. The
unfavorable business environment caused by
lackluster domestic consumption, higher oil and
raw material prices, and a stronger Korean
currency, directly affected our overall
management activities.
In spite of this negative environment
we achieved continued growth as sales of
premium products and overall exports increased.
Sales in our mobile handset business were 60%
greater than last year. This was largely due to
the successful implementation of GSM and
WCDMA handsets. Digital Display sales, which
were focused on digital TVs and PDPs, rose by
19%, and total sale revenues rose to KRW 24.66
trillion, a 22% increase.
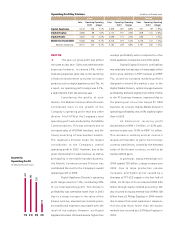
In addition to the sales growth our
profit margin was outstanding. Largely due to
the improved profits in mobile handsets,
operating income rose by 18% this year, to KRW
1.25 trillion. In addition, net income skyrocketed
to KRW 1.55 trillion, a gain of 133%. These
increases were driven by the remarkable growth
of gains on our equity share of LG.Philips LCD,
stemming from elevated LCD prices.
MOBILE COMMUNICATIONS
�Sales in the Mobile Communications
Division were up 55% over last year, reaching a
total of KRW 9.5 trillion. This remarkable
performance was largely due to the continued
growth in mobile handset sales, representing
88% of the total sales revenue of the Mobile
Communications Division. Handset shipment in
2004 reached a total of 44 million units, a
remarkable 62% increase over the previous
year. Our handset manufacturing has achieved a
growth rate of more than 45% for the fifth
consecutive year. This has helped us attain the
fifth position in the global market with 6.5%
share in 2004, increased from 5.3% in 2003.
LG Electronics has maintained its
leadership position in the global CDMA handset
market, supplying 26 million handsets in 2004,
and showing well-balanced growth in every
region of the world. Furthermore, we have
penetrated the global GSM markets in Europe
and North America, supplying over 14 million
handsets, which is up 136% over the same
portion of the previous year. With the world's
best technology, and aggressive marketing
approaches, we have secured the No.1position
in the 3rd generation mobile phone market,
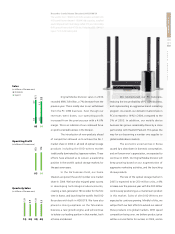
1Q 2Q 3Q 4Q
Quarterly Sales Trend
(in billions of Korean won)
5,996
6,521
6,029
6,113