LG 2004 Annual Report Download - page 4
Download and view the complete annual report
Please find page 4 of the 2004 LG annual report below. You can navigate through the pages in the report by either clicking on the pages listed below, or by using the keyword search tool below to find specific information within the annual report.-
 1
1 -
 2
2 -
 3
3 -
 4
4 -
 5
5 -
 6
6 -
 7
7 -
 8
8 -
 9
9 -
 10
10 -
 11
11 -
 12
12 -
 13
13 -
 14
14 -
 15
15 -
16
-
17
-
18
-
19
-
20
-
21
-
22
-
23
-
24
-
25
-
26
-
27
-
28
-
29
-
30
-
31
-
32
-
33
-
34
-
35
-
36
-
37
-
38
-
39
-
40
-
41
-
42
-
43
-
44
-
45
-
46
-
47
-
48
-
49
-
50
-
51
-
52
-
53
-
54
-
55
-
56
-
57
-
58
-
59
-
60
-
61
-
62
-
63
-
64
-
65
-
66
-
67
-
68
-
69
-
70
-
71
-
72
-
73
-
74
-
75
-
76
-
77
-
78
-
79
-
80
-
81
-
82
-
83
-
84
-
85
-
86
-
87
-
88
-
89
-
90
-
91
-
92
-
93
-
94
-
95
-
96
-
97
-
98
-
99
-
100
-
101
-
102
-
103
-
104
-
105
-
106
-
107
-
108
-
109
-
110
-
111
-
112
-
113
-
114
-
115
-
116
-
117
-
118
-
119
-
120
-
121
-
122
-
123
-
124
-
125
-
126
-
127
-
128
-
129
 |
 |

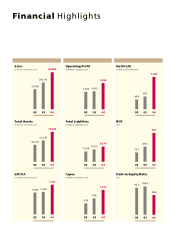
Financial Highlights
02 03 04
20,177
17,095
24,659
02 03 04
11,277
10,133
13,234
02 03 04
1,680
1,605
1,917
Total Assets
(in billions of Korean won)
Sales
(in billions of Korean won)
EBITDA
(in billions of Korean won)
02 03 04
1,029
1,250
02 03 04
7,773
7,128
8,218
02 03 04
830
533
1,274
Total Liabilities
(in billions of Korean won)
Operating Profit
(in billions of Korean won)
Capex
(in billions of Korean won)
02 03 04
663
498
1,546
02 03 04
20.4
13.7
36.3
02 03 04
108.0
96.3
74.5
ROE
(%)
Net Profit
(in billions of Korean won)
Debt-to-Equity Ratio
(%)
1,062