LG 2004 Annual Report Download - page 63
Download and view the complete annual report
Please find page 63 of the 2004 LG annual report below. You can navigate through the pages in the report by either clicking on the pages listed below, or by using the keyword search tool below to find specific information within the annual report.-
 1
1 -
2
-
3
-
4
-
5
-
6
-
7
-
8
-
9
-
10
-
11
-
12
-
13
-
14
-
15
-
16
-
17
-
18
-
19
-
20
-
21
-
22
-
23
-
24
-
25
-
26
-
27
-
28
-
29
-
30
-
31
-
32
-
33
-
34
-
35
-
36
-
37
-
38
-
39
-
40
-
41
-
42
-
43
-
44
-
45
-
46
-
47
-
48
-
49
-
50
-
51
-
52
-
 53
53 -
 54
54 -
 55
55 -
 56
56 -
 57
57 -
 58
58 -
 59
59 -
 60
60 -
 61
61 -
 62
62 -
 63
63 -
 64
64 -
 65
65 -
 66
66 -
 67
67 -
 68
68 -
 69
69 -
 70
70 -
 71
71 -
 72
72 -
 73
73 -
74
-
75
-
76
-
77
-
78
-
79
-
80
-
81
-
82
-
83
-
84
-
85
-
86
-
87
-
88
-
89
-
90
-
91
-
92
-
93
-
94
-
95
-
96
-
97
-
98
-
99
-
100
-
101
-
102
-
103
-
104
-
105
-
106
-
107
-
108
-
109
-
110
-
111
-
112
-
113
-
114
-
115
-
116
-
117
-
118
-
119
-
120
-
121
-
122
-
123
-
124
-
125
-
126
-
127
-
128
-
129
 |
 |

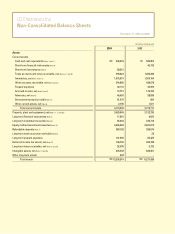
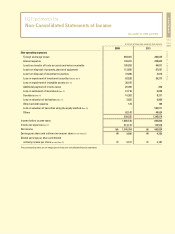
LG Electronics Inc.
Non-Consolidated Statements of Income
December 31, 2004 and 2003
LG ELECTRONICS ANNUAL REPORT 2004
062
063
Non-operating expenses
Foreign exchange losses
Interest expense
Loss from transfer of trade accounts and notes receivable
Loss from disposal of property, plant and equipment
Loss from disposal of investment securities
Loss on impairment of investment securities (Note 5 and 9)
Loss on impairment of intangible assets (Note 13)
Additional payment of income taxes
Loss on settlement of derivatives (Note 17)
Donations (Note 29)
Loss on valuation of derivatives (Note 17)
Other bad debt expense
Loss on valuation of securities using the equity method (Note 10)
Others
Income before income taxes
Income tax expense (Note 22)
Net income
Earnings per share and ordinary income per share (in won) (Note 23)
Diluted earnings per share and diluted
ordinary income per share (in won) (Note 23)
2003
286,625
208,600
96,871
67,097
2,616
29,273
-
202
6,022
8,271
9,860
184
584,571
48,624
1,348,816
836,800
173,976
662,824
4,229
4,187
(in millions of Korean won, except per share amounts)
2004
284,301
198,761
120,252
113,855
72,286
62,228
38,105
20,490
12,716
10,352
3,623
124
-
62,142
999,235
1,860,126
314,172
1,545,954
9,890
9,517
The accompanying notes are an integral part of these non-consolidated financial statements.