LG 2004 Annual Report Download - page 45
Download and view the complete annual report
Please find page 45 of the 2004 LG annual report below. You can navigate through the pages in the report by either clicking on the pages listed below, or by using the keyword search tool below to find specific information within the annual report.-
 1
1 -
2
-
3
-
4
-
5
-
6
-
7
-
8
-
9
-
10
-
11
-
12
-
13
-
14
-
15
-
16
-
17
-
18
-
19
-
20
-
21
-
22
-
23
-
24
-
25
-
26
-
27
-
28
-
29
-
30
-
31
-
32
-
33
-
34
-
 35
35 -
 36
36 -
 37
37 -
 38
38 -
 39
39 -
 40
40 -
 41
41 -
 42
42 -
 43
43 -
 44
44 -
 45
45 -
 46
46 -
 47
47 -
 48
48 -
 49
49 -
 50
50 -
 51
51 -
 52
52 -
 53
53 -
 54
54 -
 55
55 -
56
-
57
-
58
-
59
-
60
-
61
-
62
-
63
-
64
-
65
-
66
-
67
-
68
-
69
-
70
-
71
-
72
-
73
-
74
-
75
-
76
-
77
-
78
-
79
-
80
-
81
-
82
-
83
-
84
-
85
-
86
-
87
-
88
-
89
-
90
-
91
-
92
-
93
-
94
-
95
-
96
-
97
-
98
-
99
-
100
-
101
-
102
-
103
-
104
-
105
-
106
-
107
-
108
-
109
-
110
-
111
-
112
-
113
-
114
-
115
-
116
-
117
-
118
-
119
-
120
-
121
-
122
-
123
-
124
-
125
-
126
-
127
-
128
-
129
 |
 |
LG ELECTRONICS ANNUAL REPORT 2004
044
045
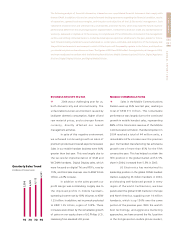
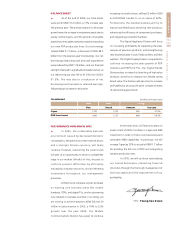
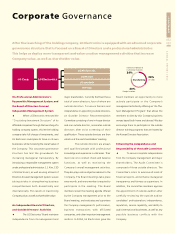
BALANCE SHEET
�As of the end of 2004, our total assets
were worth KRW 13.2 trillion, a 17% increase over
the previous year. The primary reasons for this asset
growth were the increase in investment assets due to
equity method gains, and the growth of tangible
assets from the sizable investment made in extending
our new PDP production lines. Our borrowings
totaled KRW 3.7 trillion, a decrease of KRW 48.2
billion from the previous year's borrowings. Our net
borrowings (deducting cash and cash equivalents)
were reduced by KRW 119 billion, and our financial
strength improved in a gradual but steady manner, as
our debt-to-equity ratio fell to 61.6% from 2003's
91.5%. This was due to a reduction of net
borrowings and increases in retained earnings,
followed by an increase in net income.
PERFORMANCE OUTLOOK IN 2005
�In 2005, the unfavorable business
environment caused by decreased domestic
consumption, elevated oil and raw material prices,
and a stronger Korean currency, will likely
continue. However, overcoming the current crisis
will give us an opportunity to secure a competitive
edge in our market. Mindful of this, we plan to
confront present difficulties by efficiently
managing company resources, and accelerating
innovations throughout our management
processes.
LG Electronics will place utmost emphasis
on existing core business areas like mobile
handsets, PDPs, and digital TVs, and on pioneering
new markets in overseas countries. In so doing, we
are striving to achieve between KRW 28 and 30
trillion in sales revenue in 2005, a 14% to 22%
growth over the year 2004. Our Mobile
Communications Division has a plan to continue
increasing its market share, selling 62 million GSM
and WCDMA handsets, an increase of 40%.
Furthermore, the handset business will try to
improve profitability by launching new products,
enhancing the efficiency of component purchases,
and integrating production facilities.
The Digital Appliance Division will focus
on increasing profitability by expanding the sales
revenue of premium products, and strengthening
new business bases in such fields as driers and dish
washers. The Digital Display Division is expected to
continue increasing the sales growth of PDP
modules and PDP/LCD TVs. Our Digital Media
Division plans to extend its launching of high value
products, as well as to improve our already strong
brand value. The Division will also strive to increase
profitability by securing the price competi-tiveness
of optical storage products.
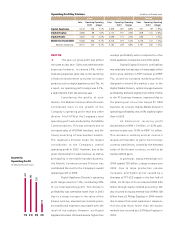
In the mean time, LG Electronics plans to
invest a total of KRW 3.5 trillion in Capex and R&D
investment in order to foster core businesses and
strengthen R&D capabilities. In particular, we will
increase Capex by 33% to a total of KRW 1.7 trillion
for building the 4th line of PDP and integrating
handset production sites.
In 2005, we will continue rationalizing
our overall businesses, enhancing financial
structures through the thorough management of
working capital and the improvement of our
profitability.
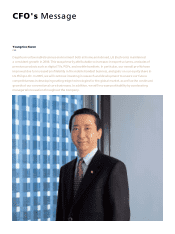
CFO Young-Soo Kwon
Investment (in billions of Korean won)
2005 2004 Change
Plan Result Amount Increase
Capex 1,700 1,274 426 33.5%
R&D Investment 1,800 1,131 669 59.2%