LG 2004 Annual Report Download - page 81
Download and view the complete annual report
Please find page 81 of the 2004 LG annual report below. You can navigate through the pages in the report by either clicking on the pages listed below, or by using the keyword search tool below to find specific information within the annual report.-
 1
1 -
2
-
3
-
4
-
5
-
6
-
7
-
8
-
9
-
10
-
11
-
12
-
13
-
14
-
15
-
16
-
17
-
18
-
19
-
20
-
21
-
22
-
23
-
24
-
25
-
26
-
27
-
28
-
29
-
30
-
31
-
32
-
33
-
34
-
35
-
36
-
37
-
38
-
39
-
40
-
41
-
42
-
43
-
44
-
45
-
46
-
47
-
48
-
49
-
50
-
51
-
52
-
53
-
54
-
55
-
56
-
57
-
58
-
59
-
60
-
61
-
62
-
63
-
64
-
65
-
66
-
67
-
68
-
69
-
70
-
 71
71 -
 72
72 -
 73
73 -
 74
74 -
 75
75 -
 76
76 -
 77
77 -
 78
78 -
 79
79 -
 80
80 -
 81
81 -
 82
82 -
 83
83 -
 84
84 -
 85
85 -
 86
86 -
 87
87 -
 88
88 -
 89
89 -
 90
90 -
 91
91 -
92
-
93
-
94
-
95
-
96
-
97
-
98
-
99
-
100
-
101
-
102
-
103
-
104
-
105
-
106
-
107
-
108
-
109
-
110
-
111
-
112
-
113
-
114
-
115
-
116
-
117
-
118
-
119
-
120
-
121
-
122
-
123
-
124
-
125
-
126
-
127
-
128
-
129
 |
 |
LG Electronics Inc.
Notes to Non-Consolidated Financial Statements
December 31, 2004 and 2003
LG ELECTRONICS ANNUAL REPORT 2004
080
081
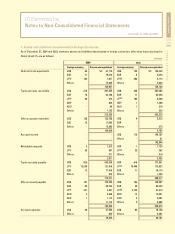
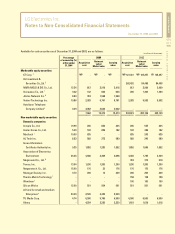
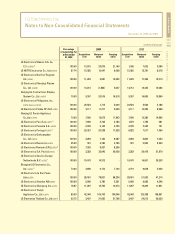
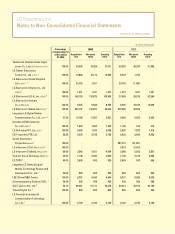
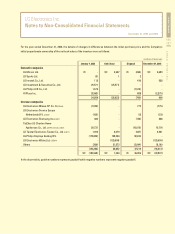
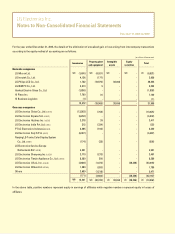
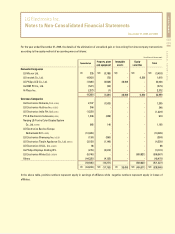
10. Equity Method Investment Securities
Equity method investment securities as of December 31, 2004 and 2003, are as follows:
(in millions of Korean won)
111,651
-
154,651
125,082
2,399,076
16,522
99,275
28,264
6,114
36
30,823
116
-
11,438
356
-
-
20,621
3,786
-
9,888
6,960
2004
120,716
-
148,963
140,549
2,572,987
16,689
108,965
28,264
6,115
36
22,350
116
-
15,508
1,637
7,305
-
21,869
5,038
22,484
16,562
7,659
68,100
-
59,308
119,282
726,169
11,907
100,511
28,200
4,500
36
7,684
116
-
3,746
967
1,558
7,410
14,718
3,330
56,154
13,779
5,856
36.00
-
69.80
20.00
44.57
49.00
100.00
94.00
100.00
49.00
49.00
100.00
-
100.00
100.00
100.00
100.00
50.00
100.00
100.00
100.00
100.00
Percentage
of ownership (%)
at December
31, 2004
Net asset
value
Acquisition
cost
Carrying
value
86,070
1,204
137,039
-
1,259,904
14,548
60,806
28,200
4,500
36
33,007
116
53,116
19,106
-
-
-
19,353
2,175
25,279
12,293
5,856
2003
88,030
1,203
135,142
-
1,447,016
17,739
78,942
30,864
4,500
36
30,576
116
79,784
23,188
1,660
9,544
-
19,895
991
44,314
16,302
5,856
52,315
1,404
59,308
-
726,169
11,907
70,511
28,200
4,500
36
7,684
116
63,940
3,746
967
1,558
7,410
14,718
3,330
37,614
13,779
5,856
Net asset
value
Acquisition
cost
Carrying
value
Domestic companies
LG Micron Ltd. 4
LG Sports Ltd. 7
LG Innotek Co., Ltd.
Hankuk Electric Glass Co., Ltd. 6
LG.Philips LCD Co., Ltd. 9
LG IBM PC Co., Ltd. 10
Hi Plaza Inc. 4
STIC Ventures Co., Ltd.
Hi Business Logistics
Overseas companies
Goldstar Electronics Thailand
Co., Ltd. (G.S.T.) 2
Hitachi-LG Data Storage Inc. (HLDS)
LG Electronics Austria GmbH(LGEAG) 2
LG Electronics Alabama, Inc.(LGEAI) 8
LG Electronics Almaty Kazak
Co., Ltd. (LGEAK)
LG Electronics Antwerp
Logistics N.V. (LGEAL)
LG Electronics
Australia Pty,Ltd. (LGEAP) 1
LG Electronics Argentina S.A.(LGEAR) 3
Arcelik-LG Klima Sanayi ve
Ticaret A.S. (LGEAT)
LG Electronics Colombia, Ltda.(LGECB)
LG Electronics China Co., Ltd.(LGECH) 1, 4
LG Electronics Canada, Inc.(LGECI)
LG Electronics Inc.
Chile Limitada(LGECL)